Data analytics are critical to the success of your blog or website. Without them, you are literally flying blind. Unfortunately, Google Analytics can be intimidating and confusing for non-data science or math people. As both a travel blogger and a data scientist, I want to introduce you to several key data analytics you should be tracking for your blog. These analytics are easy to measure, report, and understand, even if you’re not good with numbers.
The Basics of the Google Algorithm
I don’t even begin to know the intricacies of Google’s algorithm, but the bottom line is that Google looks for sources that have two things: reputation and value. It promotes what it determines to be the highest value content from the most reputable sources. As a result, Google will consider a blog with high volumes of traffic and engagement rates that has been around for years a much more reputable source than a brand new blog that has barely any traffic.
To be successful with organic search traffic, every piece of content you publish should work to build your reputation and provide incredible value. That value will slowly grow your reputation over time, as blogging success is very much a long-term game. Don’t expect to see any kind of success overnight.
While this blog has existed in various forms for the better part of 15 years, we’ve only been doing it seriously for the past two and a half years. In 2021, we finally started to see our efforts pay off, but there’s still so much potential and growth we have yet to unlock. And that’s exactly what our next chapter aims to accomplish.
Traffic Volume Analytics
There are three key metrics you should be tracking to monitor your blog or website’s traffic volume. Traffic volume is simply the amount of users and visitors that visit your site.
| Metric | Definition |
|---|---|
| Users | A visitor who has initiated a session on your website |
| Sessions | A group of interactions with your website that take place within a given time frame |
| Page Views | An instance of a page being loaded or reloaded in a browser. |
So what is the relationship between these metrics? A single user can initiate multiple sessions. In fact, they start a session whenever they visit any page on your website. Likewise, a single session can consist of multiple page views.
User Acquisition Analytics
Knowing where your users are coming from is critical for your success. It’ll tell you whether your marketing and SEO efforts are working. Furthermore, it’ll help you optimize when to post new content so you can maximize the number of people that consume your content. Finally, identify flaws in your website’s design, holes in your workflow, and leaks in your funnel. Then you can easily fix them so you can accomplish the goals, sales, and conversions that matter most to you.
Where Are Your Users Coming From?
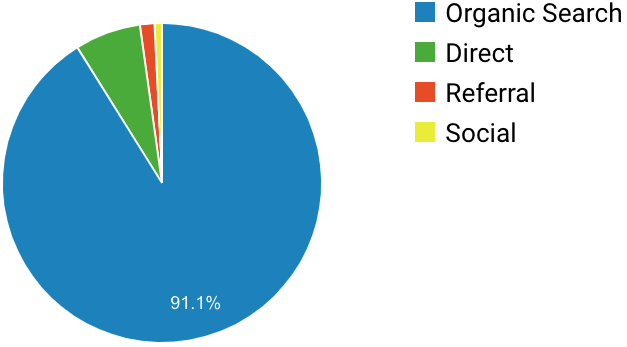
Google Analytics breaks down traffic sources to your website or blog into 10 channels, which are just categories. In Google Analytics 4, these sources are listed under “Default Channel Grouping.” On the other hand, they’re listed under “Top Channels” if you’re using Universal Analytics.
If you’ve implemented your SEO correctly, the vast majority of your traffic should come from Organic Search. Indeed, the analytics show that about 90% of the traffic to this blog this past week came from organic search. Even though we don’t run paid ads and are not terribly active on social media outside of YouTube, we plan to further diversify those sources over the next six to nine months as our marketing efforts ramp up.
| Channel | Traffic Source |
|---|---|
| Direct | Enters your website’s URL directly into their browser. |
| Organic Search | Clicks on a link to your website that any search engine returns |
| Referral | Links to your site that appear on other websites. Social media sites and search engines are excluded from this metric. |
| Social | Referred directly from any social media platform |
| Clicks on a link in an email marketing campaign that you or someone else sends out. Links you send via regular email do not appear in this metric. They appear under Direct sources instead. | |
| Paid Search | Clicks on a paid ad you run through Google, Bing, or any other search engine. |
| Affiliates | Any links you use for affiliate marketing. |
| Display | Traffic you receive from banner, sidebar, and other ads that run on other websites. |
| Other Advertising | Inbound traffic from any advertising source that does not fit into any of the above categories |
| (other) or (unavailable) | Traffic that does not fit into any of the above categories |
Drill Down Even Further into Your Analytics
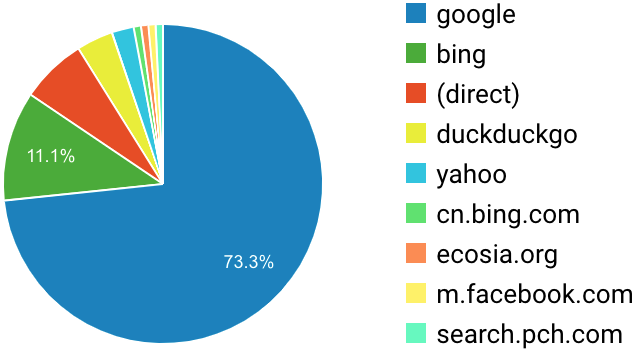
You shouldn’t stop there when it comes to evaluating the sources of your traffic. To go further, look at the Source/Medium metric in your analytics. They will tell you exactly where your traffic is coming from. And you may be surprised at the results. Even though most of our traffic this week came from Google, that’s not always the case.
For example, you may find that the majority of your search engine traffic is coming from Bing or DuckDuckGo instead of Google. Or maybe you’re getting more conversions from Twitter and LinkedIn instead of Facebook and Instagram. Will that affect your marketing or SEO strategy?
How Are Visitors Finding Your Blog?
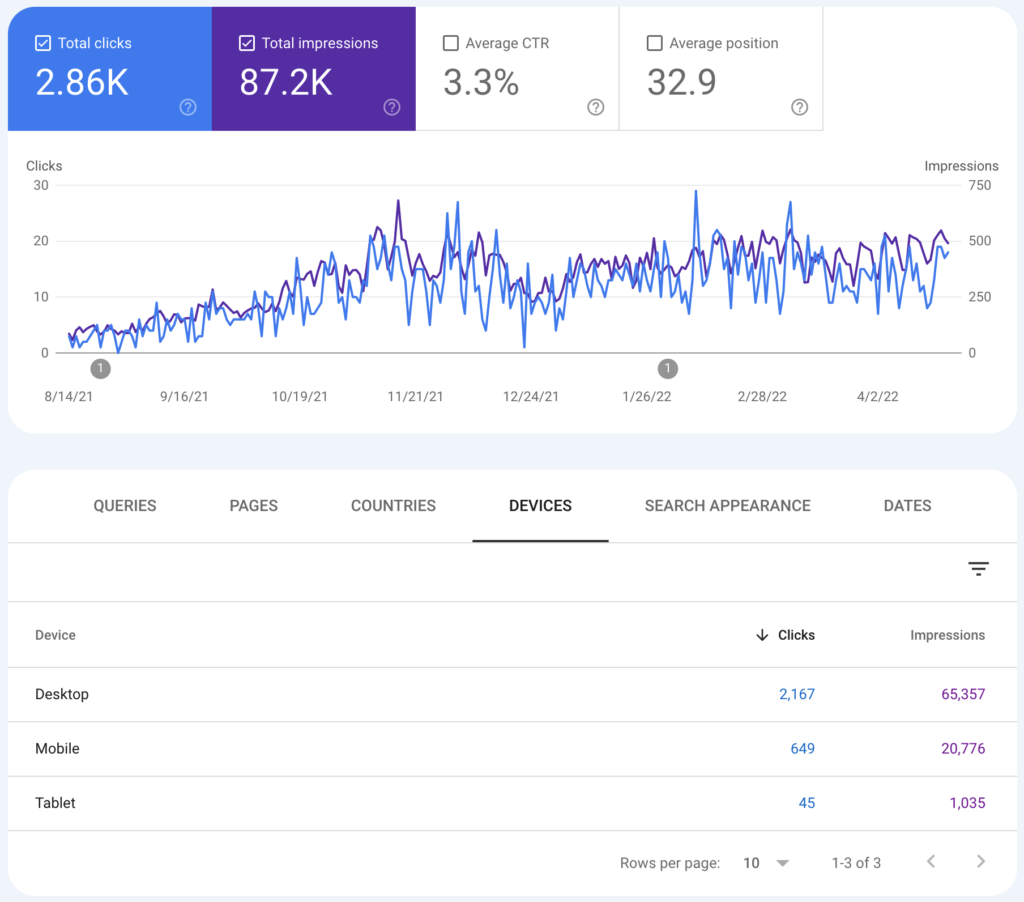
Google Analytics provides a wealth of information about how your users are finding your blog. But to unlock its full potential, you’ll need to tap into Google Search Console. The search console analytics will tell you exactly how your website or blog is performing in Google’s search engine. Most powerfully, it will tell you the exact search terms or queries people are using to reach your site.
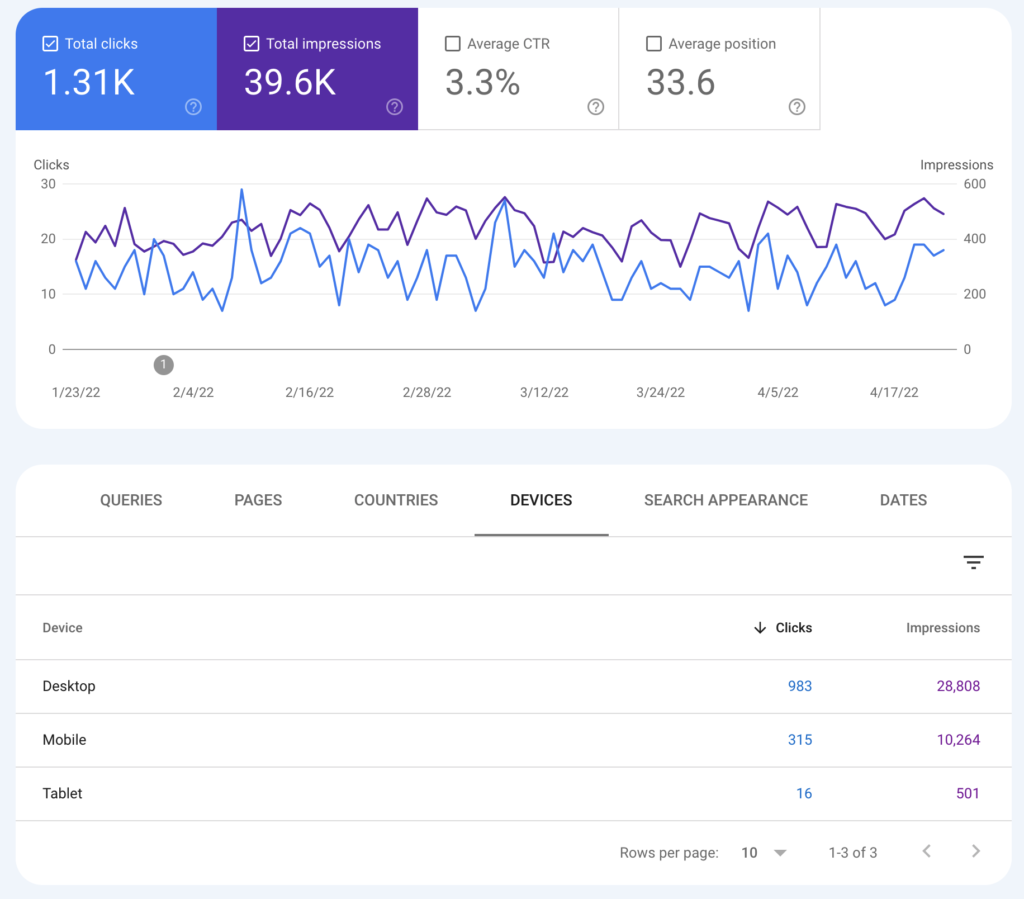
As you consistently add more content, you should see these metrics slowly creep up over time. Remember that SEO is a long game. You won’t see immediate success overnight. So what do these analytics mean?
| Metric | Definition | Goal |
|---|---|---|
| Total Clicks | Number of times someone clicked on your content in a Google Search | Higher is better |
| Total Impressions | Number of times your content appeared in Google search results | Higher is better |
| Average Click-Through Rate | Equals total clicks divided by total impressions | 2-3% is good. Above 5% is excellent. |
| Average Position | The average position your content appeared in the Google Search results. | Lower is better |
Keep in mind that Google Search Console only covers Google searches. Because the majority of our traffic comes from Google, the search console is a key part of our SEO efforts. However, you shouldn’t stop there, though. Take advantage of analytics from Facebook, Twitter, Instagram, YouTube, and wherever else you get traffic from. Without that data, you’re essentially running blind. Only then will you get the full story of how your visitors are finding you.
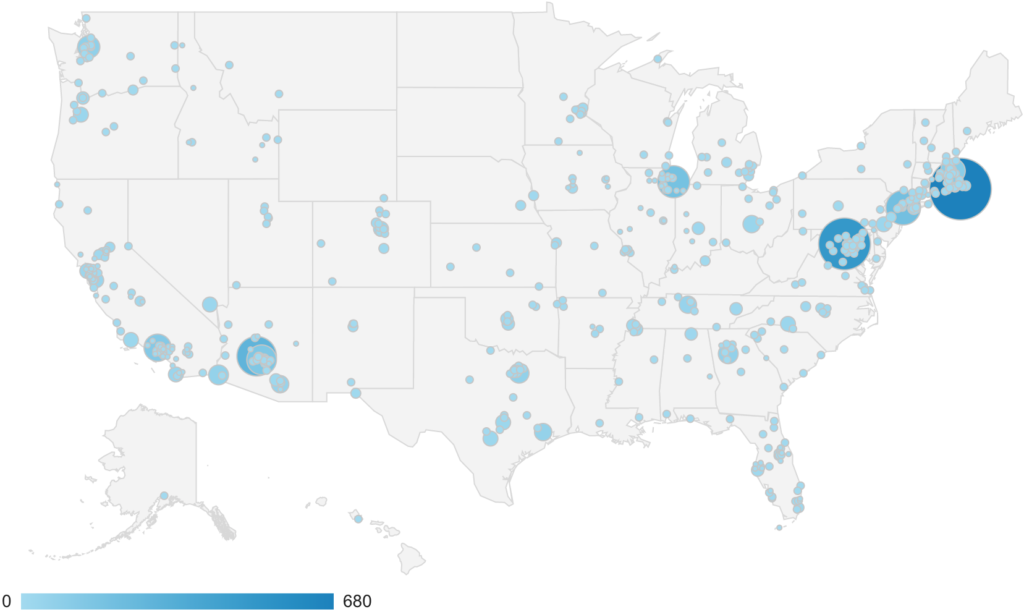
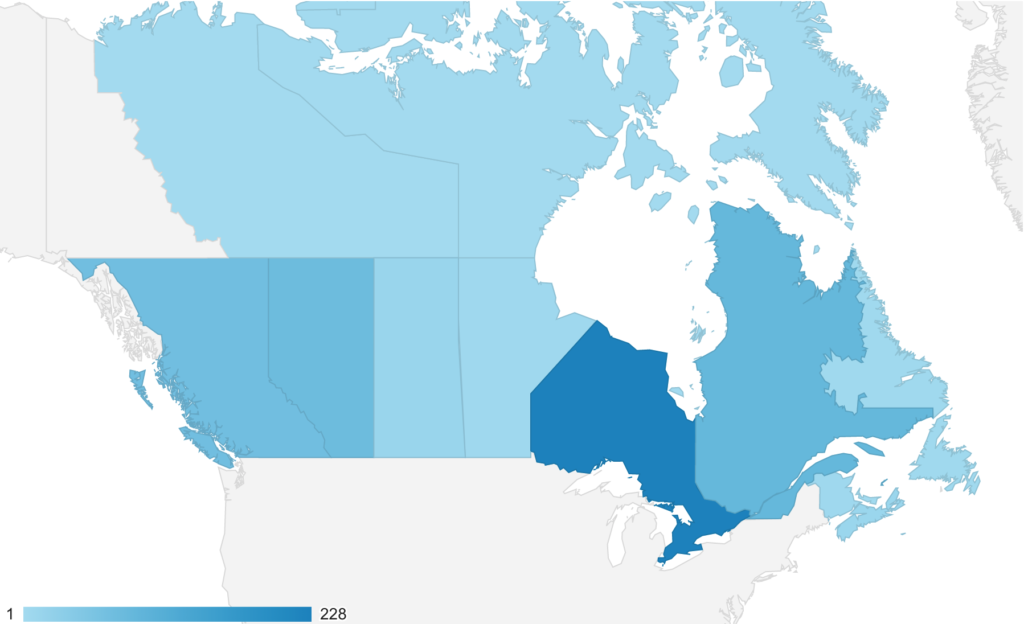
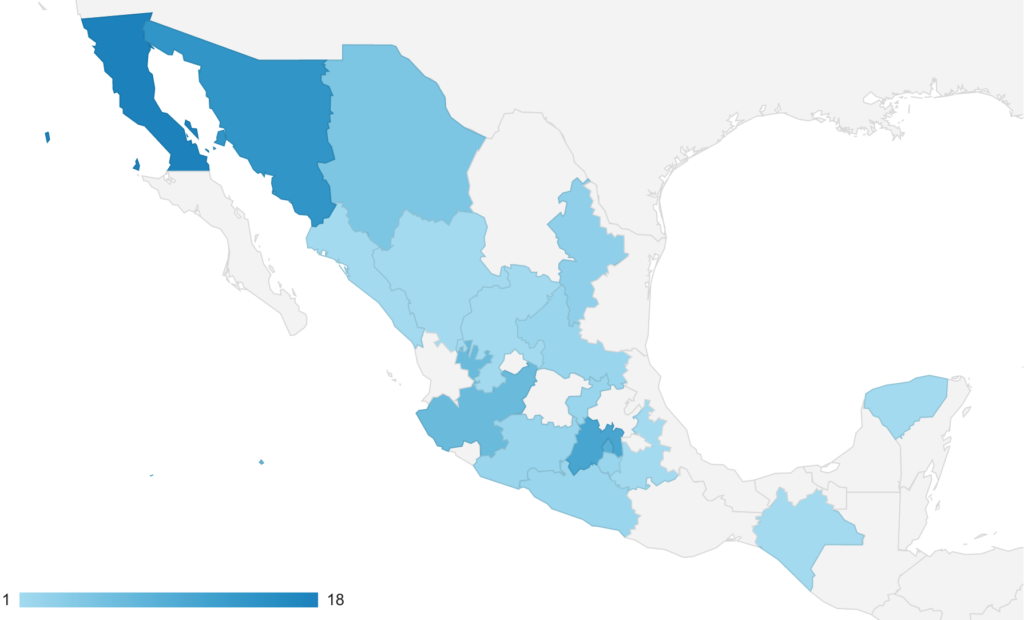
What Geographic Location Are Your Users Coming From?
Knowing the geographic location your users are coming from can be very beneficial to your marketing and content schedule. It can also help you identify new potential markets to push into.
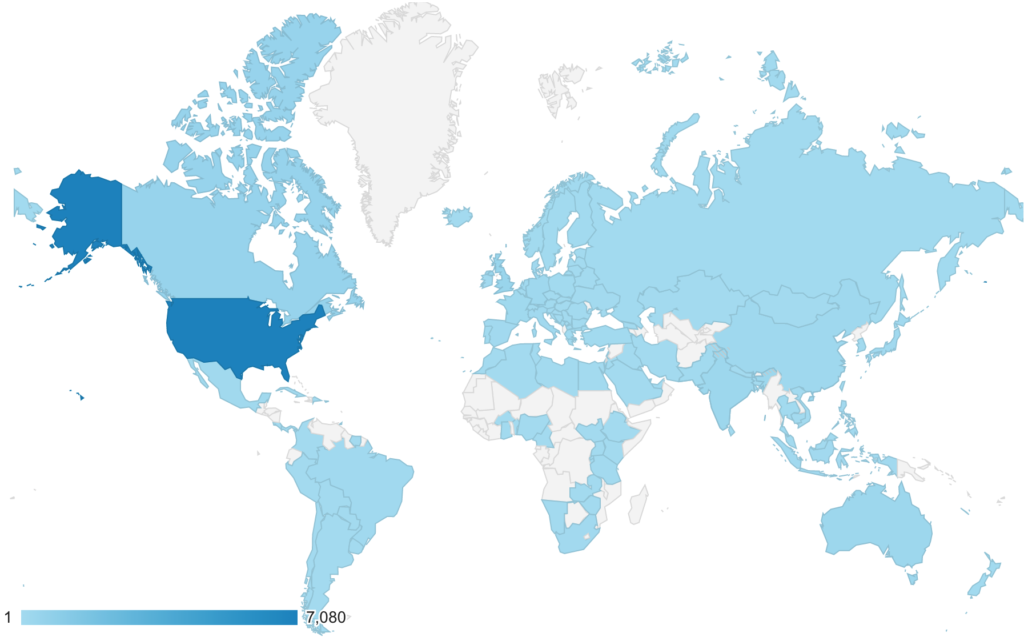
Like most location-based data, this information is incredibly valuable. And I’m not just saying that as a GIS expert. Drill down in your analytics to determine exactly where in each country your content has the highest consumption rates. With Google Analytics, you can see as specific as which city or town your traffic is coming from.
So what exactly can you do with all of this data? The list is endless, but there are a few things that come to mind at first.
- Identify geographic regions for which to tailor your content
- Target new geographic regions into which you can expand your business
- Plan your next trip, photo shoot, blog post, or other content creation
- Target certain types of advertising for different geographic regions
- Add support for languages in countries from which you’re getting lots of new traffic
When are Users Visiting Your Website or Blog?
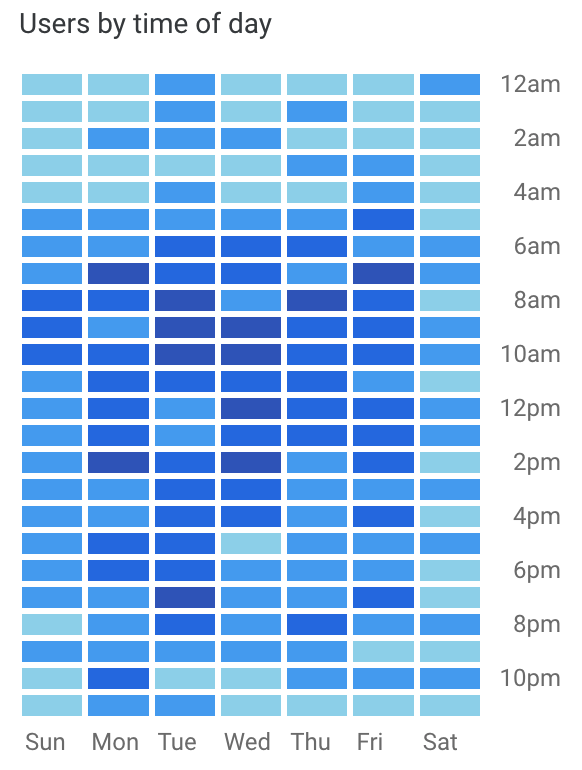
Google Analytics provides two easy ways to track which days of the week and what time of day your visitors are coming to your blog. First, you can use the grid you see to the right to identify exactly which days and times your blog gets the most traffic.
Why is this information important? It allows you to optimize what days and times you release new content. Take a look at the chart to the right. It shows that we’ve been getting the most traffic between about 8 and 11 AM on Tuesdays and Wednesdays.
Try scheduling your content releases to coincide with the peak traffic to your website or blog. To get the best idea of when you should release your content, change the timeframe of your traffic grid. Look at data from the past 1, 3, 6, and 12 months. If traffic patterns are consistent throughout those time periods, schedule your content to be published right before your peak traffic.
In the example above, it looks like we should probably change our publishing schedule. I would consider publishing either Monday afternoon or Tuesday at 5 or 6 AM. It may take some trial and error to get right, but it’s well-worth the effort.
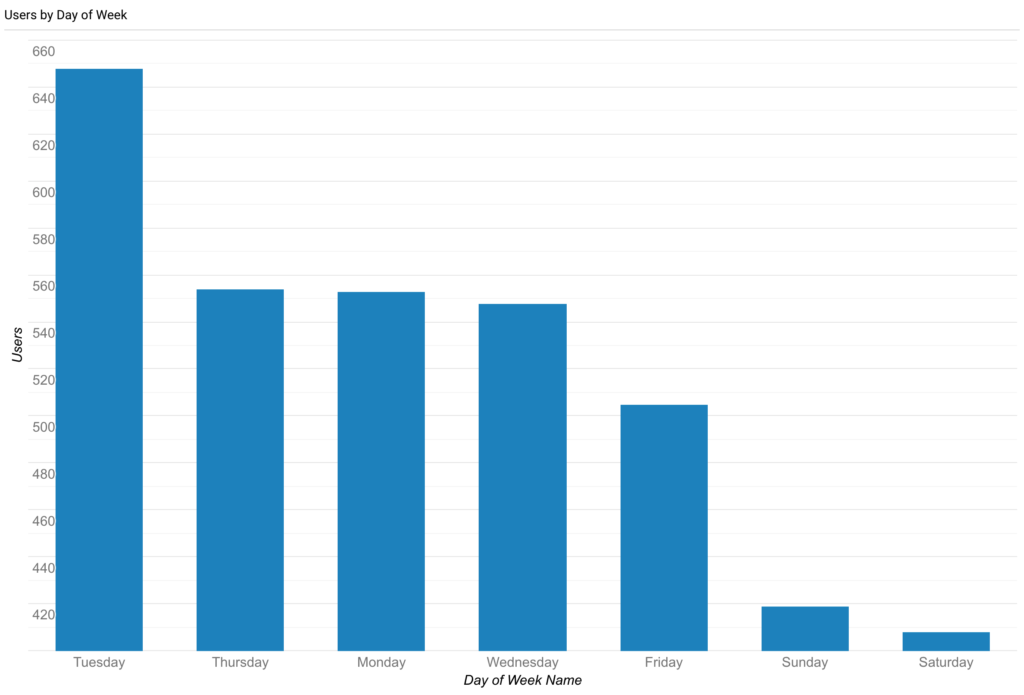
Additionally, if the grid confuses you, you can always publish the same data on a good old fashioned bar chart. On a dashboard, create a bar chart showing Users that is grouped by Day of Week Name. It won’t give you times of day, but it’s clear as day which day of the week generates the most traffic.
What Devices Are Your Visitors Using?

By implementing a proper responsive web design, your website or blog should be optimized for screens of all sizes. However, that doesn’t necessarily mean that your traffic will be evenly split between desktop, mobile, and tablets. Most websites and blogs will see the majority of their traffic coming from desktop devices, a metric which includes laptops.
Once you have a baseline established, keep monitoring your analytics. If those metrics start to change, it’s time to figure out why. User behavior will shift and evolve over time. However, if you notice a big shift all of a sudden, there’s likely something wrong with your website or web design that is driving users of a particular device off of your website.
Drilling down, you can monitor plenty of details in your blog analytics. At the very minimum, keep track of what screen size, browser, and operating system your visitors are using. That way, you can make sure that your blog is best optimized for the devices that are giving you the most traffic.
Visitor Behavior
Now that you know the volume and source of traffic to your blog, let’s have a look at how people are behaving when they’re on your site. Using Google Analytics, you can pinpoint the exact elements that visitors are clicking on and interacting with. Use this knowledge to optimize your goals and funnels, and in turn, maximize your conversions.
Are Your Visitors Engaged?
You can have all the traffic in the world, but until you can engage your visitors, it’s meaningless. However, as we begin to shift from Universal Analytics to Google Analytics 4, you need to know the difference in how each version measures engagement rate.
If you’ve used Google’s Universal Analytics, you’re probably familiar with the bounce rate. The bounce rate is simply the percentage of sessions where users only viewed a single page and triggered a single request to the Analytics server. However, if you have a single page website or landing page, the bounce rate can be very misleading. Because there are no other pages to visit, the bounce rate will always be 100%. Unfortunately for you, Google interprets that as a completely disengaged page that is not providing any value.
Google Analytics 4 Makes Tracking Engagement Much Easier
Thankfully, the engagement rate in Google Analytics 4 is a much more accurate way to measure visitor engagement. Google has done away with the Bounce Rate and replaced it with the Engaged Sessions Rate. To be considered engaged, your visitor must do one of the following during their session.
- Actively engage with your website or blog for at least 10 seconds in the active window or tab.
- Successfully complete a conversion
- Visit two or more pages
As a result, single pages no need to worry about being shunned for having a high bounce rate. By actively engaging the user or completing a conversion, they can be considered engaged without requiring the user to visit a second page.
What Are Visitors Clicking On and Interacting With?
Google Analytics provides a very valuable tool that can measure how users are interacting with your website or blog. Use Google Tag Manager to set custom events to track what your visitors are engaging with. I use custom events to track nearly every clickable item throughout all of my websites, but especially on the home pages. Because the home page is one of the primary landing pages, we need to ensure that users can find the content they’re looking for.
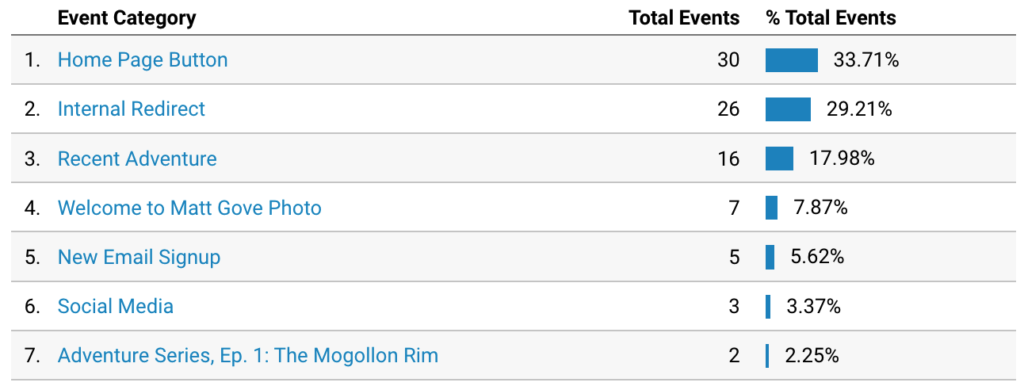
If something on your page is getting a lot of interaction, double down on it. On the other hand, maybe something else is not getting any clicks or engagement. The analytics will tell you why, so you can fix it or replace it with something that does.
What Pages are Your Visitors Navigating To on Your Blog? How are They Flowing Through Your Website?
Google Analytics shows you exactly how visitors are flowing through your website. It’s a great way to plot multiple conversion funnels on one chart. Unfortunately, it can be intimidating if you’re not familiar with flow charts and data analytics.
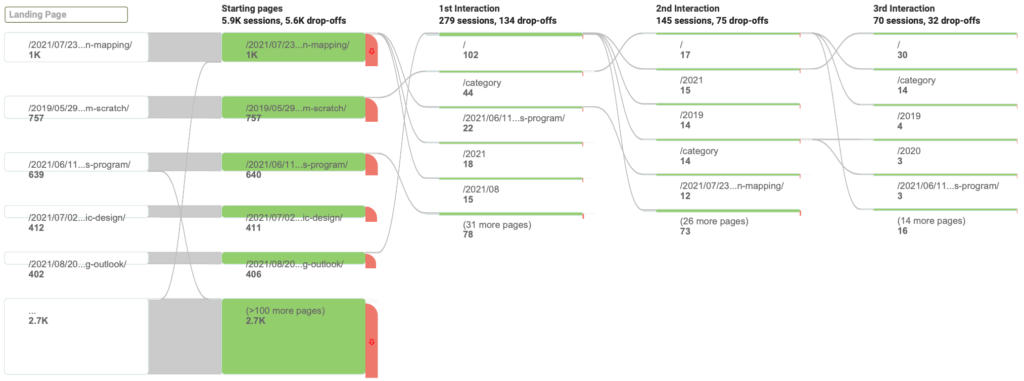
In addition to visitors’ progression through your funnel, you’ll see the number of sessions and drop-offs at each step. Depending on what kind of website you’re running, your baseline Key Performance Indicators (KPI’s) will be slightly different. For example, a blog will have a pretty high drop-off rate after the first landing page or interaction. Think about how you read blogs. You enter your search term into Google, and click on a result. You read the article, and then navigate back to the search results to visit the next article. Turns out that’s what most other people do too. That’s why blogs tend to have high drop-off rates.
On the other hand, e-commerce websites have a much more specific and highly-tuned conversion funnel because the conversions are sales. They should have much lower drop-off rates than a blog. Furthermore, you should look at the percentage of drop-offs, not just the raw number of drop-offs because the numbers can be misleading. More popular pages will have more drop-offs simply because they get more traffic. That doesn’t necessarily mean there is a problem converting visitors.
Regardless of what kind of website you have, look for pages that have a high percentage of drop-offs. You’ve just identified the leaks in your conversion funnel. Once you know where the leaks are, you need to figure out why they’re leaking. Most likely, you’re missing a clear next step or call to action.
How Long are Visitors Spending on Each Page of Your Website or Blog?
If you’re running a blog, you should have a pretty good idea of how long it takes to read or skim a particular article. Your analytics should reflect those times. If most visitors are only spending a few seconds on your page, you are either not making a good impression or your content is not providing enough value. Longer times that still come up well short of your expected read times often indicate readers are losing interest in your content mid-way through. I actually set up scroll events to track how far users scroll down through each post before leaving.
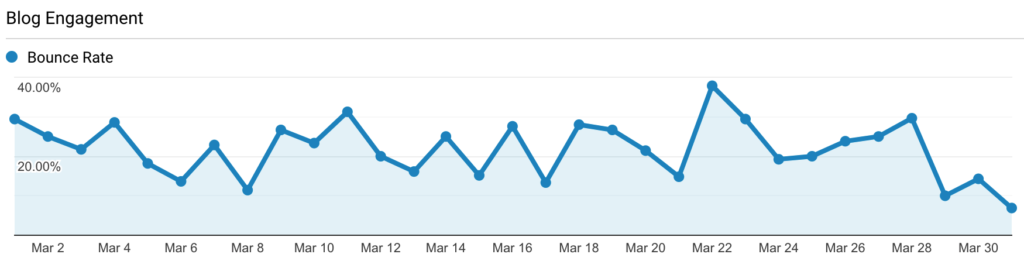
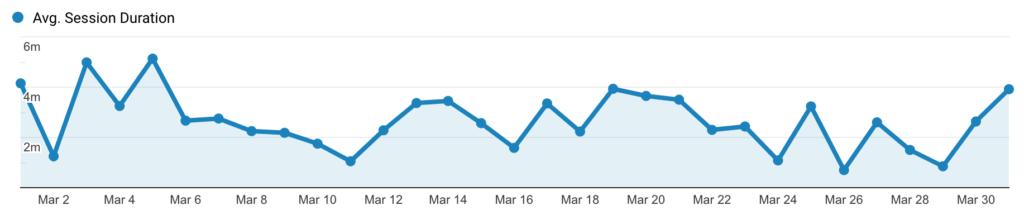
On this blog, I know that most people can skim or read our posts in anywhere from two to five minutes. Indeed, the analytics from March, 2022 reflects that. You won’t hit your targets every single day. However, as long as most of your data falls within that target range and the misses are close, you’re doing fine.
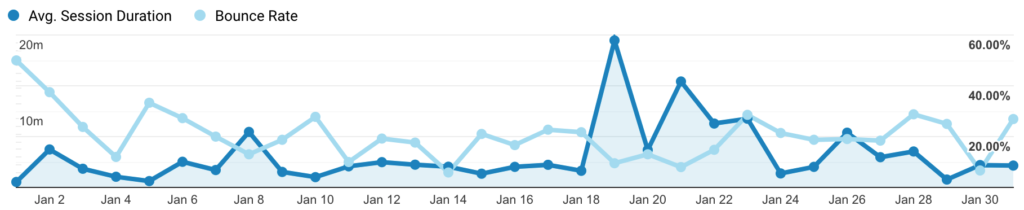
Unfortunately, the Average Session Time in Universal Analytics can get skewed if someone reads your article, and then leaves it open in their browser. If you see session durations spike really high for just one day, that’s likely from people leaving your site open in their browser. However, you should always check your session times against bounce rates. If high session times coincide with a drop in bounce rate, congratulations! Your site is actively and highly engaging visitors. It means that visitors are spending high amounts of active time on your blog and navigating to multiple pages on the site.
Because Google completely redefined engagement in Google Analytics 4, you’ll find more accurate metrics there. Combined into a single “Average Engagement Time” metric, you no longer need to compare two different metrics to obtain an accurate measure of engagement on your blog. It’s much easier to interpret and understand than the combination of session duration and bounce rate you need to use in Universal Analytics.
What Landing Pages are Visitors Landing On? What Page are They Exiting from?
Knowing the entry and exit points of each funnel on your website or blog is critical to your success. And best of all, you don’t need the complicated flow charts from earlier to identify them. I actually created a custom dashboard in Google Analytics to track the information on both this blog and all of my websites. It’s certainly not the sexiest thing in the world, but it contains a ton of information.

Let’s go over what those four tables are telling you. The top two are just overall summaries of page views and user engagement. Likewise, the bottom tables have the most valuable information. The bottom left table tells me where visitors are entering this blog during a given time frame. It lists the most popular landing pages, and the percentage of new sessions from users who have never been to my site for each landing page.
On the other hand, the bottom right table shows where visitors are leaving the blog. Like we discussed earlier, don’t forget that popular pages will get more exits than your less-visited pages. And that does not mean that they are a failure. Instead, you’ll want to consider exit percentages as well. To calculate those percentages, simply divide the number of exits by the number of page views.
exit_percentage = exits / pageviewsUnfortunately Google Analytics does not provide the exit percentage. If you want to add a calculated field, you’ll need to put everything into Google Data Studio. We’ll cover that in a future tutorial. But for now, I find that a quick back-of-the-envelope calculation works fine for me.
An Important Lesson from My Blog
You may recall that up until quite recently – less than a year ago – this blog was nothing more than a feed of posts that supplemented the Matt Gove Photo and Matthew Gove Web Development websites. It lacked the home page, the Start Here page, the portfolio, and all of the bio sections. As a result, we suffered from high bounce rates, low engagement, and poor search performance. At the end of July, 2021, one simple update changed everything.
We decided to transform the blog from just a feed that supplemented our other websites until a full-fledged website and valuable resource that could stand on its own. We added the Home Page and the Start Here pages. After optimizing all of our old posts to align with our new SEO strategy, we pumped every page, menu, and sidebar full of links to supplemental valuable content, as well as calls to action for the next steps in our conversion funnel.
After this one, albeit major, upgrade to the blog, we saw results in the analytics less than a month later. Remember with the Bounce Rate, lower is better.
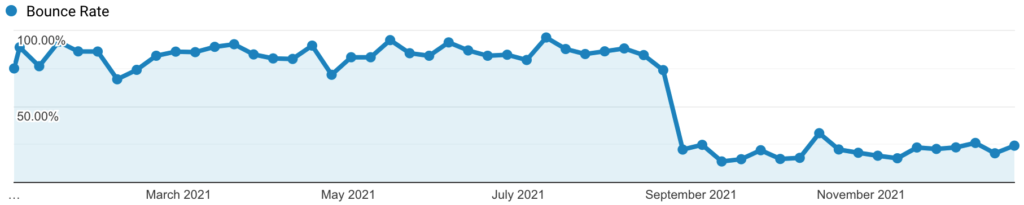
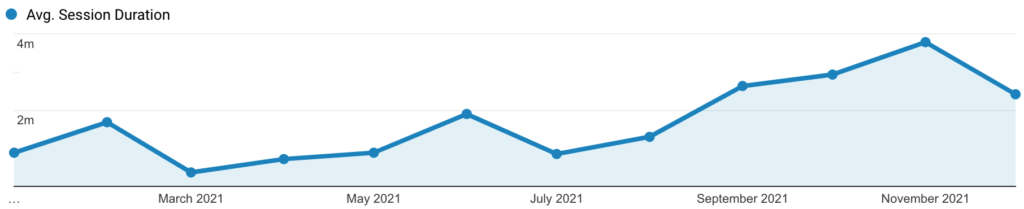
Additionally, we saw traffic increase nearly an order of magnitude, or about 800%, between August and December, 2021. As a result, our Google search performance shot way up as well.
The lesson here is to use your blog or website’s analytics to identify, where holes in your conversion funnel, why users are leaving your site, and how you can patch those holes to both retain and grow you follower base. Get your content in front of as many people however you can. Remember you need to publish content that has value. You can’t just spam people asking them to visit your blog.
While 2021 was a significant step forward for our blog, we hope there are many milestones to come as we grow both this year and beyond. This is still just the beginning for us. We can’t wait to share more of this incredible journey with you.
Conclusion
Data analytics are one of the most important components of a successful website or blog. When implemented correctly, your blog analytics will tell you what’s working and what’s not. In fact, they’ll even guide you down the path to success. Because without blog analytics, you’re literally flying blind. In today’s hyper-competitive environment, you simply can’t afford to.
We’ve only scratched the surface of the power of blog analytics. In addition to Google Analytics, we’ll cover how to use Google Search Console and Data Studio in the context of blogging in future posts. While we’re at it, we’ll go over the critical analytics to track for e-commerce sites as well. If you would like more of these tutorials, please subscribe to our newsletter, and leave any questions or thoughts you have in the comments below.