During a monsoon storm last week, I observed evidence of a possible tornado. Today, we will look at some of the data from the storm. I built weather station and data logger at my house that logs data every 5 minutes. While I have plans to put a network of sensors at the house, the weather station currently gets its data from Lake Pleasant, which is about 15-20 miles from my house, via the Weather Underground API. Evidence of a possible tornado near the house obviously won’t show up on data from 15 miles away, but it’s still really neat to look at.
Desert storms are rather unique in nature compared to many other locations and climates. Extremely dry air near the surface causes high bases of the thunderstorms, and can also lead to violent downbursts as the storm’s updraft collapses. As the moist air descends in the storm’s downdraft, evaporative cooling takes place as it hits the dry air near the surface, causing it to accelerate downward even faster than it already was. When it hits the ground, it fans out in all directions, and can cause violent winds, dust storms, and in certain cases, landspouts and tornadoes.
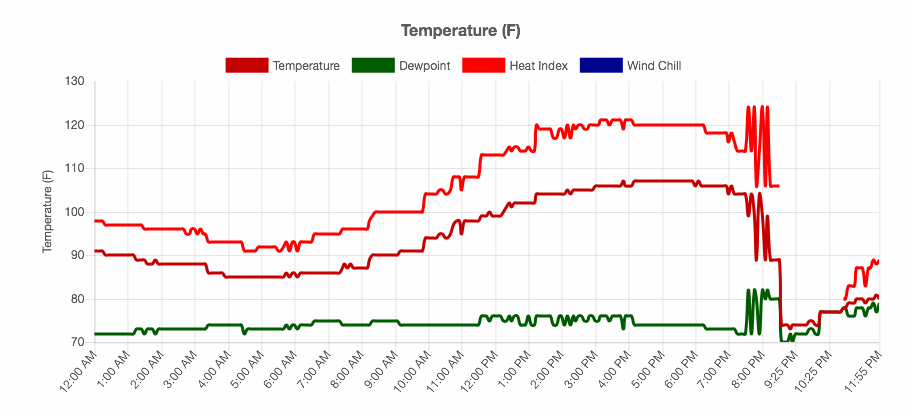
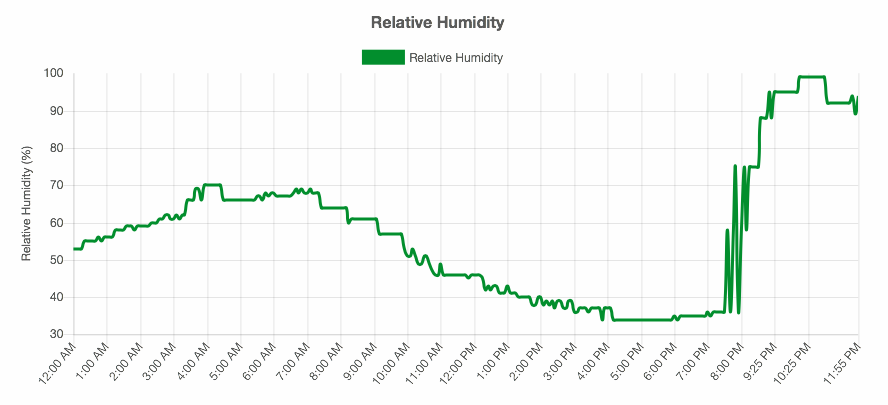
I downloaded the 24-hour data for July 30th (the day the storm hit) from my weather station onto my computer to look for patterns of the storm. Remember from my post on the storm that the mayhem all started between 8:00 and 8:30 PM (the storms would have arrived at Lake Pleasant a little earlier than that). As you can expect, some signs were obvious, and some were not. The temperature and humidity plots are pretty much what you would expect: rain cooled air causes temperatures to drop and humidities to rise. One interesting thing to note is the bump in dew point (the green line) while the storm passed overhead between 8:00 and 9:30 PM, since dew point is not dependent on temperature. That increase in moisture is from the precipitation as the storm passed overhead. We will confirm this later on with the precipitation plot.
The wind plot was an interesting one to look at, and should be taken with a bit of a grain of salt because wind sensors can give false readings during high winds, which can break them, and dust storms, which can penetrate the sensor’s bearings if it’s not set up properly. Furthermore, the terrain at Lake Pleasant can cause low readings, too. If you’ve never been to the lake, it’s surrounded by steep mountains, which can block the wind.
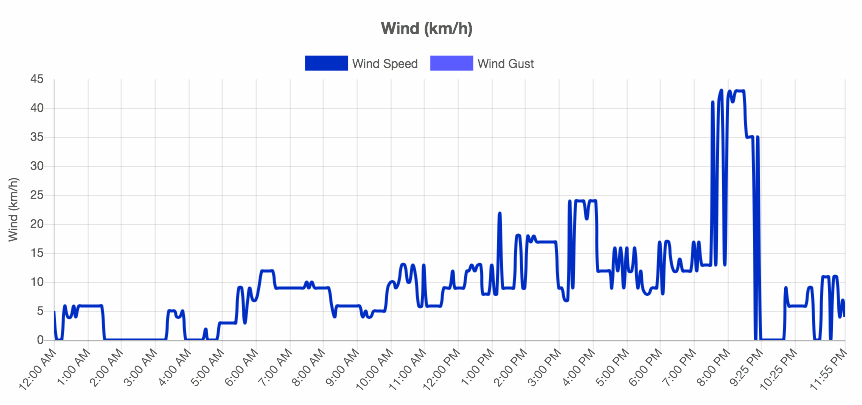
There are 2 things that immediately jump out at me at this plot:
- The maximum wind gust measured at Lake Pleasant was 60 km/h (38 mph). This seems really low since there were confirmed wind gusts at the Deer Valley Airport and along the Loop 303, which are less than 10 miles from the lake but in open desert and away from the mountains, over 120 km/h (75 mph).
- With the amount of wind that was associated with this storm, why is there suddenly no wind data between 9:30 and 10:30 PM? Did the sensor break or go offline? Did the mountains block the wind?
I can’t say for certain, but my inclination is that the mountains knocked the wind down and caused the low peak wind gust reading, and that the sensor went offline between 9:30 and 10:30 PM. The reason it went offline could be anything from a power or network outage to being struck by lightning.
Remember what I said earlier about the temporary bump in dew point related to the rain? When we look at the precipitation plot, you will notice that the bump in the dew point is about an hour offset (earlier) from the precipitation. The dew point increase lasts from about 7:30 to 9:30 PM, while the precipitation occurs from 8:30 to 10:15 PM. What gives?
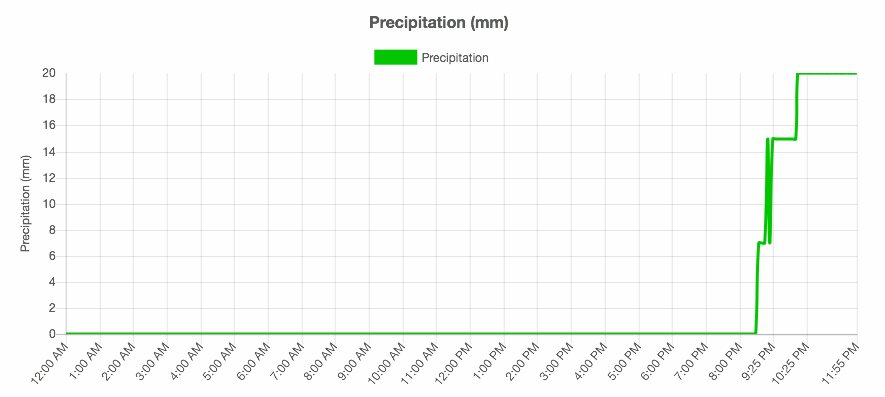
Well, it turns out there’s a combination of things that cause the offset, and in reality, the rain actually arrives earlier than the plots show. The tipping bucket rain gauges that are used in today’s weather stations cannot measure the start of the rain. The “start” of the rain is indicated by the first tip of the bucket, which usually requires between 5 and 10 millimeters of rain to fall. However, it doesn’t make up for the full hour difference, especially given how hard it rains in some of these storms.
The increase in the dew point actually starts when the cool, moist outflow boundary or gust front passes over the weather station, which is usually well ahead of the rain arriving. In these types of monsoon storms in Arizona, the gust front is usually indicated by a haboob. If you’re inside the haboob, you’re actually in the cooler, moist air of the storm’s outflow, even though it probably doesn’t feel like it. So the offset in the dew point and precipitation data is caused by the moist air arriving ahead of the rain, and the rain actually starting before the rain gauge can measure rainfall.
Next up is the pressure plot. I know tornadoes and fronts are localized areas of low pressure, but when a storm passes overhead, the opposite actually happens: you may see a quick drop in pressure as the gust front approaches, but you will get a spike in pressure due to the cooler, more moist air in the storm’s outflow being more dense than the hot, dry desert air.
In the plot below, the gradual drop in pressure throughout the afternoon has nothing to do with the evening thunderstorm. It’s actually caused by the diurnal heating cycle that you see every day. It gets so hot in the Phoenix area this time of year that the air thins out enough for it to be detected by pressure sensors. You can pretty clearly see the spike in pressure starting around 7:30 PM as the gust front and the storm passes overhead.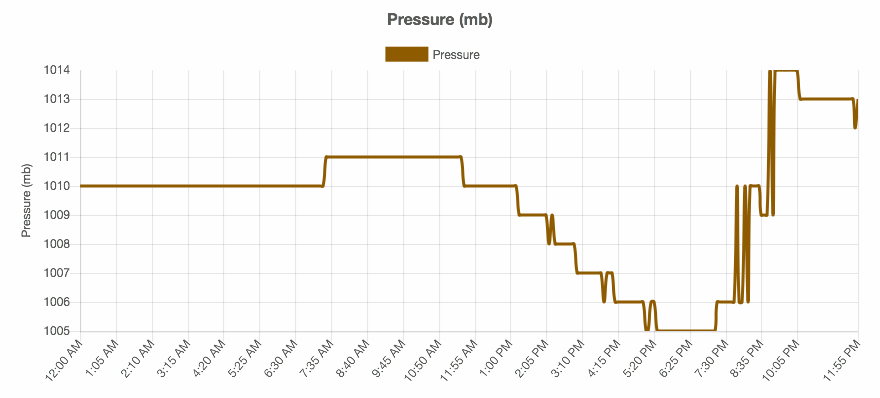
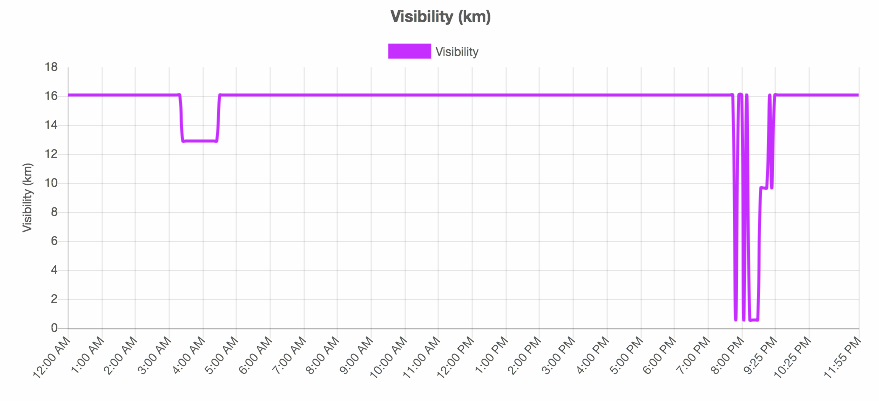
The final plot is the visibility plot. While this plot has given me some bizarre readings at times, it actually did a pretty good job handling both the haboob and the thunderstorm. Visibilities less than 1 km were right on par with what I observed in the storm.
So again, you obviously can’t confirm any tornadoes from this data (you probably wouldn’t be able to even if the tornado made a direct hit on the weather station), but I think seeing this kind of data in real world examples is really cool. I have also attached the raw data from my weather station in CSV format from 6 PM to midnight in both metric and imperial units if you’re interested further.