Wow, it’s hard to believe that the hardware for taking sensor readings for the DIY weather station is finally all in place. Now, it’s time to dive into the programming and the software end of things that makes everything click. The software for the sensor and the data logger consists of two primary parts:
- A database to store the data
- A script that takes sensor readings, QA/QC’s those readings, and logs them in the database.
From Sensor To Database
The flow of data from the sensors to the weather station’s primary database, is as follows. The primary database contains the full set of weather data. It logs data every 5 minutes. The weather station’s web interface displays those data. Data for which I do not have sensors are obtained from the National Weather Service.
- A Python script reads data from the sensors and logs them in the data logger every minute
- The Python script QA/QC’s the raw data read from the sensor.
- The script puts salid or “good” data points into the database, in default metric units. It flags invalid or “bad” data points and puts them into a separate table so the primary database cannot get any “bad” data.
- Every 5 minutes, a Python script associated with the primary database queries the database containing the sensor data. It takes the most recent set of “good” data points that fall within that 5 minute period and inserts that data into the primary database, along with the data it obtains from the National Weather Service. If no “good” data points fall within that 5 minute period or if the sensor or the data logger are offline, it obtains the data from the National Weather Service.
- Once per day, data measured by the sensors are synced with the primary database to ensure that the primary database has the correct sensor data in the event of a network outage.
Database Design
I could easily write an entire post about database design, so I’m not going to go into too much detail of why I made the decisions to design the database the way I did. Instead, here is my list of requirements for the database:
- Uses all the standard practices of relational databases
- Only store raw, non-calculable data from the sensors.
- Data that can be calculated from the sensor output do not need to be in the database.
- This database is separate from the primary database for the DIY weather station, which I described above
- Properly normalized to third normal form
- Easily scalable up and down
- Only store raw, non-calculable data from the sensors.
- Store information about the sensors (manufacturer, model, serial number, etc)
- Have a mechanism to handle bad data points flagged by a QA/QC system
- Be easily queryable to pull data into the primary database for the DIY weather station (more on this later in this post)
From that list of requirements, this is the EER diagram I came up with for the sensor database.
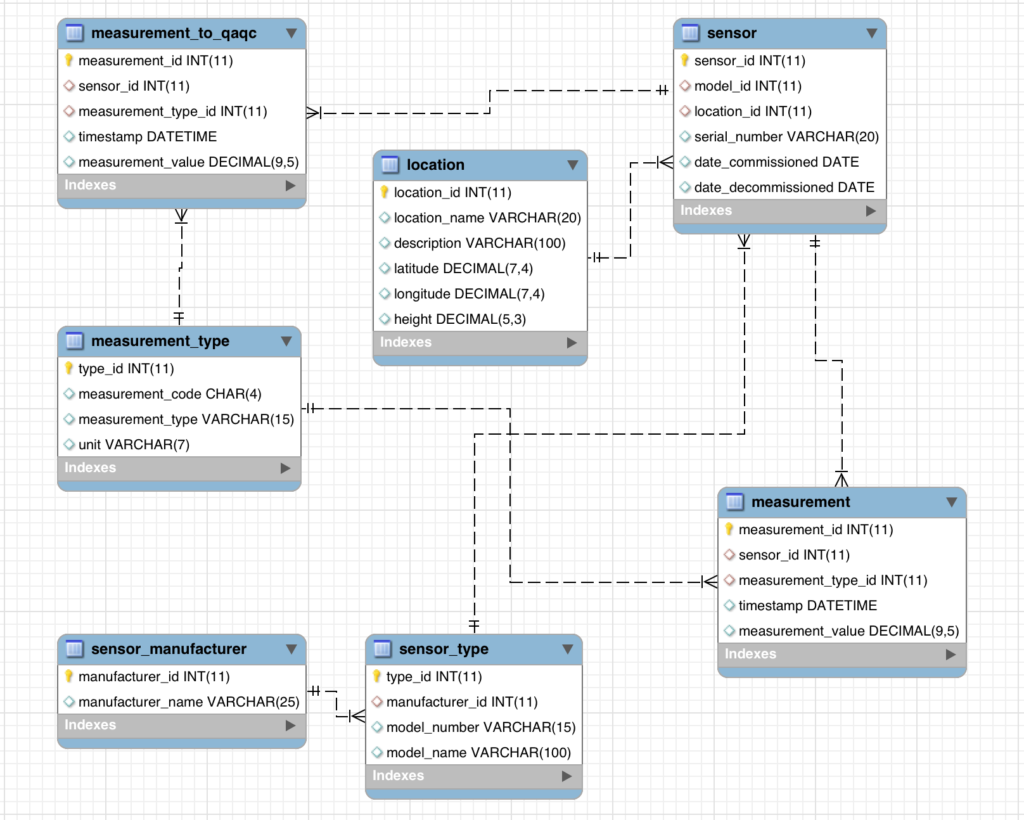
Note here that the “good” data are put into the “measurement” table, while the “bad” data flagged by the QA/QC mechanism are put into the “measurement_to_qaqc” table.
The Python Script
The Python script is where all the magic happens. Its main purpose is to QA/QC the data it reads from the sensors, essentially acting as a guard so bad data points do not get into the weather station’s primary database.
The first iteration of the QA/QC algorithm is quite simple, and is to a degree, a bit crude. Essentially all it does is to just ensure that the data are within acceptable ranges. For example, the script flags and removes relative humidity readings of 3,285%, as well as the temperature readings of -145°C.
I haven’t begun coding a version 2 of the QA/QC algorithm, but it will look at trends in the data and eliminate unrealistic spikes. For example, if the sensors show that the temperature rose 20°C over the course of a couple minutes, that would be flagged and removed by the QA/QC algorithm. In the current first version, you could in theory have temperature readings of 10°C and 30°C within a minute of each other and the algorithm would not flag it, because both temperature values are within the acceptable or realistic temperature range.
Python Classes to Parse Sensor Readings
Within the Python code, there are classes for each type (make/model) of sensor. To instantiate an object of one of these classes, they are passed the GPIO pin in the data logger to which they are connected, as well as the Sensor ID, which is the primary key in the “sensor” table in the database described above.
The sensor classes also perform the following:
- Read the raw data from the sensors and QA/QC those readings.
- Round all data readings to a maximum of 5 decimal points, which the database requires
- Inserts the data read from the sensors into the database.
- Convert raw pressure to mean sea level pressure
- Run a test measurement. The user manually calls the test method, which takes a sensor reading and dumps the data to a Terminal window without interacting with the database.
The primary script in the data logger Python module performs the following steps to log the sensor data:
- Instantiates an instance of the appropriate sensor class for each sensor in the weather station network
- Loops through each sensor
- Reads the data from the sensor
- QA/QC’s the data from the sensor
- Inserts the “good” data into the database
Well that just about wraps up the sensor and data logger portion of the DIY weather station project. I certainly had a blast designing and building, and I hope you enjoyed reading about it. Until next time.