During one of the New England Patriots’ recent runs to a Super Bowl victory, head coach Bill Belichick put it pretty well: “Do Your Job.” Everybody in the organization, from the owners all the way down to the team’s interns, had a job to do in order for the team to win the Super Bowl. Anyone not doing their job is doing nothing but getting in the way of the team’s success.
You can say the same thing about the COVID-19 pandemic. We all have a job to do to beat this thing. Every single one of us. Please use common sense, stay informed, and heed the warnings, guidance, and orders from your local, state, and federal government. Just like Hurricane and Tornado Warnings, there is a reason they are issuing warnings right now. Let’s have a look at why.
A New Type of Model: The SIR Model
Last week, we took a look at modeling the COVID-19 pandemic in the United States using Gaussian functions. Gaussian functions are also known as bell curves. Not surprisingly, there are more accurate ways to model a pandemic like this than with bell curves. Today, we are going to look at different scenarios using the SIR (Susceptible, Infected, Resistant) model. The SIR model is a simple model that uses a system of three differential equations to specifically model disease outbreaks.
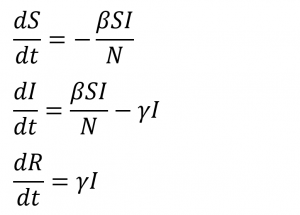
The relationship between the equations is:
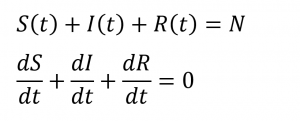
Getting into how to solve the differential equations is a discussion for another time. In English, the equations and variables describe:
- S(t) – The number of susceptible people (people who have not yet contracted the disease) over time
- I(t) – The number of infected people (people who are currently sick) over time
- R(t) – The number of resistant people (people who have either recovered or died) over time. The model assumes that recovered people cannot get sick a second time.
- Note: In the model outputs below, I have broken R(t) down into recovered and dead.
- β – controls how often a susceptible-infected contact results in a new infection
- γ – The rate an infected person recovers and moves into the resistant phase
Introduction to R Naught
Now, you’re probably wondering where the “R naught” parameter comes in. R naught, denoted as R0, is the reproduction number. It is just a fancy way to say the average number of susceptible people to which an infected person spreads the disease. For example, if R naught is 3, it means that one infected person spreads the disease to an average of 3 other people over the course of their illness. We’ll define R naught as:
R0 = β / γ
Now, before we jump into the model, let’s have a look at the model inputs. Within the model, we need to define the population N. The population of the United States is about 330 million. We also need to define the average duration of infection, which according to the CDC is about 14 days. The initial conditions for each equation [S(t), I(t), and R(t)] were set so the numbers mirror the actual data of the outbreak in the United States so far.
The only input to the model is the R naught parameter. While we will be running the model for different scenarios, we’ll start with what the US Federal Government currently defines for R naught: R0 = 2.3. Keep in mind that these figures assume R0 is constant, while in the real world R0 is changing constantly.
A Few Short-Term SIR Model Predictions for the United States
First, a couple of short-term predictions from the SIR model, again assuming a constant R0.
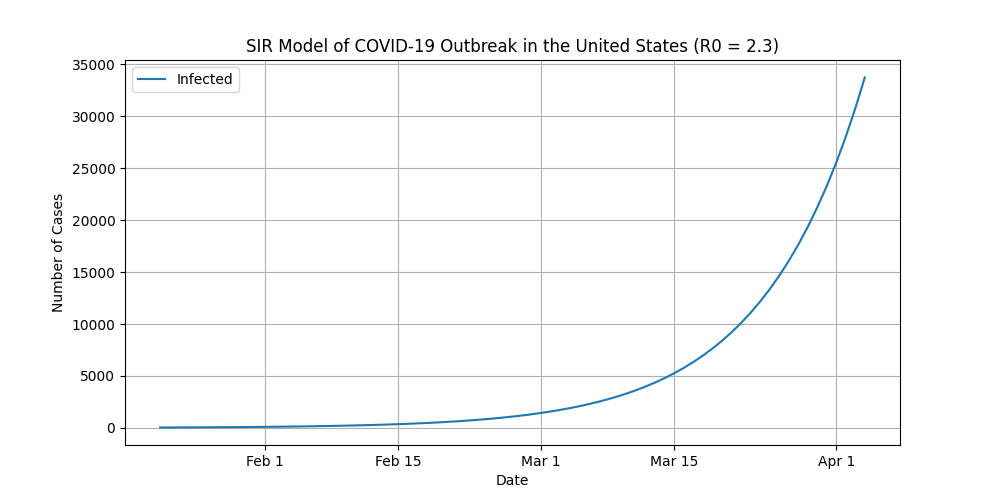
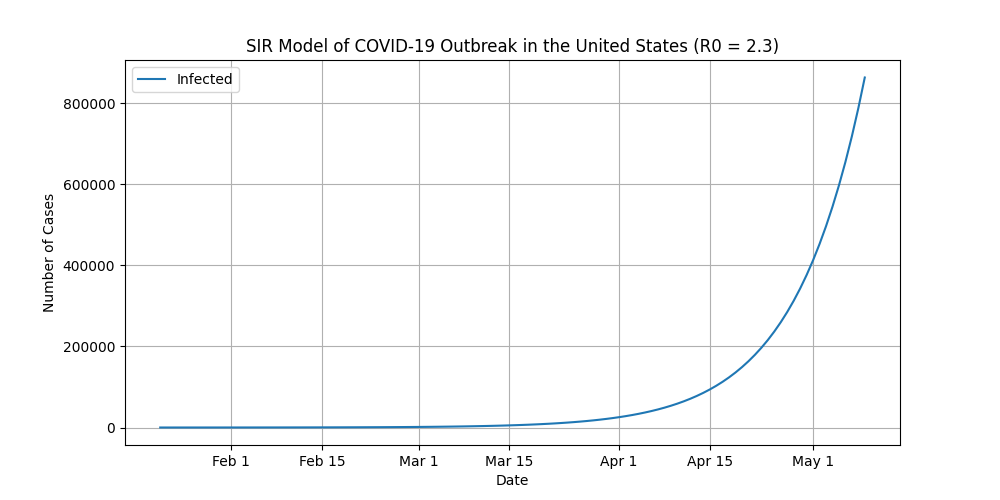
Before we plot everything out over the course of the pandemic, I need to point out a few very important things:
- The plot (and the above plots) assumes R0 stays constant at 2.3. In the real world, R0 is constantly changing.
- Because R0 stays constant, it means that this scenario does not account for preventative measures, such as restrictions on large crowds, restaurant and bar closings, travel bans, and shelter-in-place orders.
- This is a worst-case scenario and the odds of this actually playing out are very slim.

Flattening the Curve
Flattening the curve. You hear it all over the news. What does it mean? If you leave the virus unchecked, it will grow exponentially and quickly overwhelm the hospital system when all of the sick patients show up at once. Instead, health authorities want to slow down the rate the disease is spreading and spread the sick patients out over time so hospitals can handle the volume of patients.
So how do we slow down the rate the disease is spreading? Simply lower the value of R naught. Okay, in the real world it’s quite a bit more complicated. Federal, state, and local governments across the country are putting measures in place to slow down the spread of the virus and reduce R naught, which may include:
- Bans on large gatherings
- Quarantines and Self-Isolation
- Closing of schools, restaurants, bars, museums, and other public places where people tend to gather
- Cancellations of Events
- Closing Borders and Travel Bans
- Shelter In Place Orders and Lockdowns
Still don’t believe me that flattening the curve works? Have a look at the following figure. I ran the SIR model several times with identical parameters, only varying the R naught values. Like the above examples, R naught remains constant for each run. These are just hypothetical scenarios and are not any kind of indication that anything like this will actually play out in the real world.
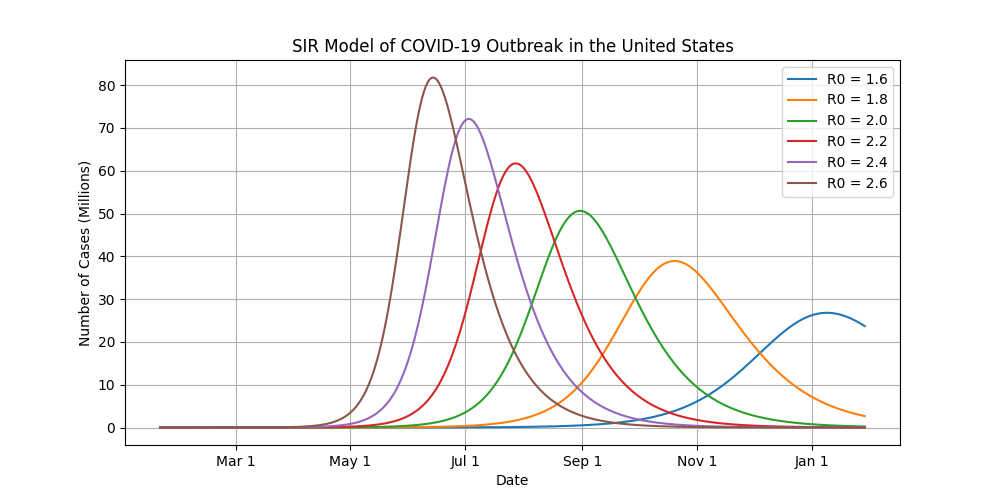
By reducing the R0 value from 2.6 down to 1.6, the number of infected people at the peak of the outbreak drops from 80 million down to about 25 million. For those of you that are mathematically challenged, that’s about 2/3, or 67% fewer infected people at the peak of the outbreak.
Modeling the Changing R Naught Values
The easiest way to model the changing R naught values is to use piecewise functions to solve the differential equations. That just means we will assign different values of R naught for different values of time (t in the differential equations at the top of this post). If you’ve ever done numerical analysis or numerical integration, you’ve probably come across piecewise functions at some point, but that’s a discussion for another day.
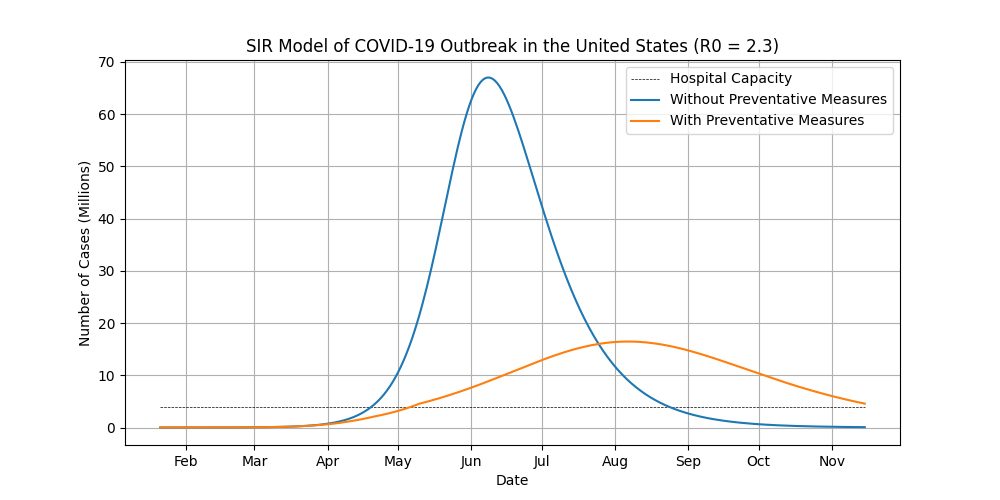
So how does this all translate to the real world? Consider a scenario that we’ve seen in a lot of countries so far in this pandemic. The virus spreads undetected within the community at the start of the outbreak. Then, federal, state, and local authorities put increasingly restrictive measures into place. Restrictions start with bans on large gatherings. They then escalate to closing down restaurants, bars, and other public places. Finally, officials order a mandatory shelter-in-place or lockdown.
To illustrate this visually, I modeled a hypothetical scenario where the virus starts with R0 = 2.3. It spreads undetected for about 45 days at the onset of the outbreak. The government orders restrictions, scaling down R Naught until the issuance of a shelter-in-place order. In this scenario, it takes about a month to go from issuing the first restriction to a full lockdown. In the real world, the restrictions are implemented much faster than that. For example, it took Italy 12 days to go from just a handful of cases to the entire country under lockdown. It took Spain 9 days to do the same.
Looking at the Real World
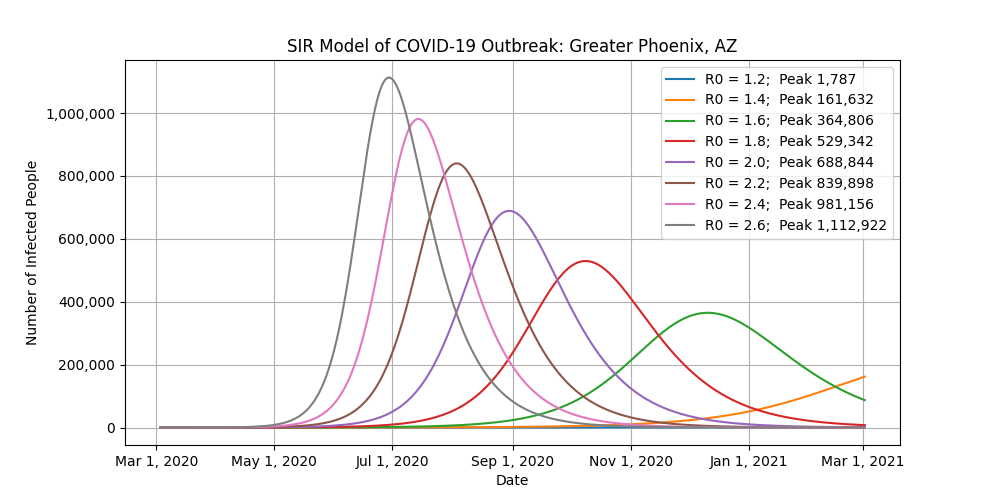
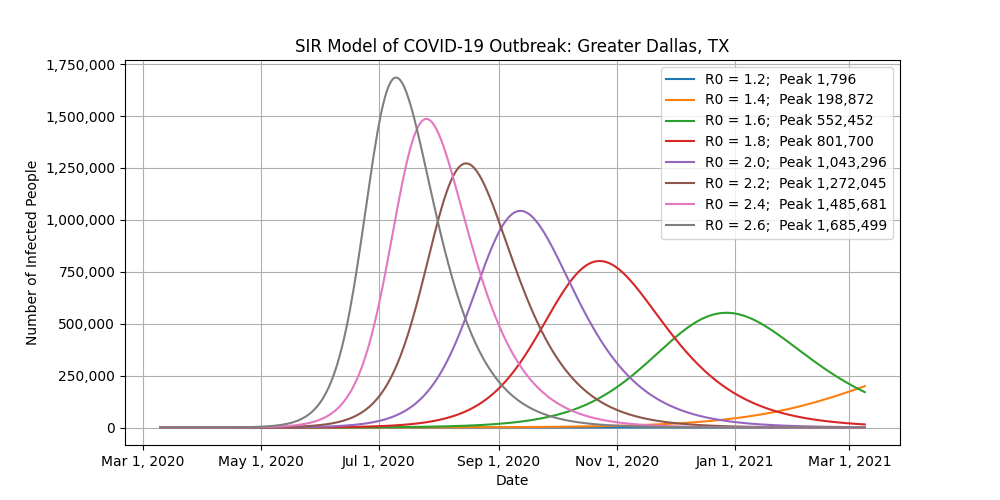
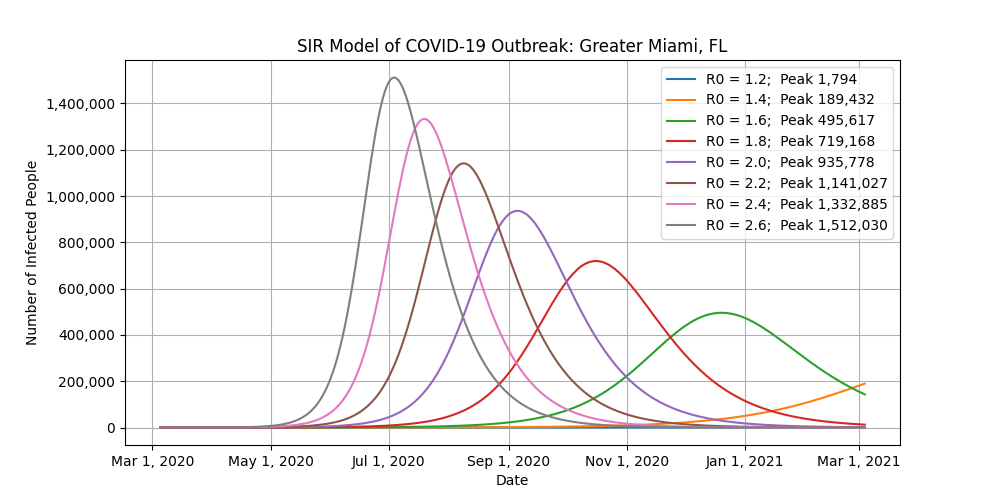
This is where it gets tricky. Because the United States is so big and diverse, let’s look at ten major cities instead. Different states, counties, and cities have enacted different bans to combat the virus, making it nearly impossible to accurately use this model at a national level. For example, the shelter-in-place that was just issued for the San Francisco Bay area is not going to affect what’s going on in Seattle, Chicago, or New York.
A Few Things to Keep in Mind
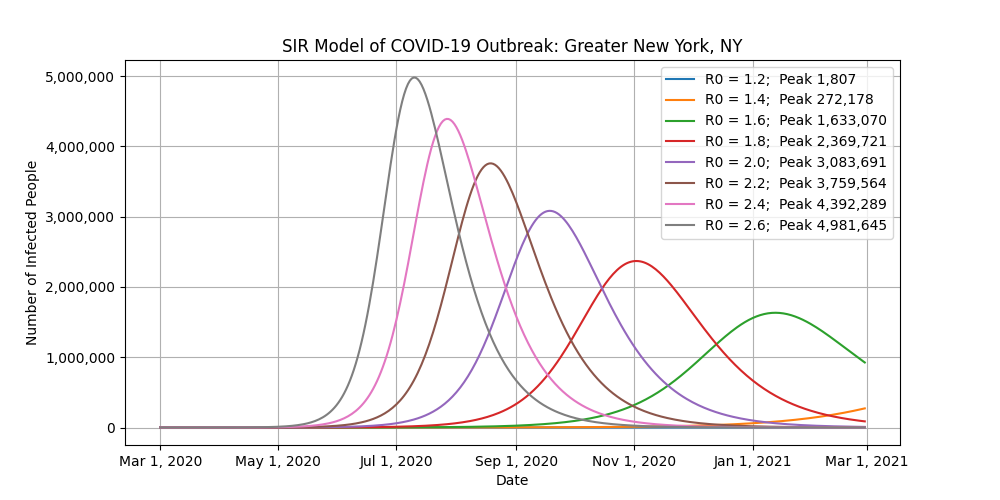
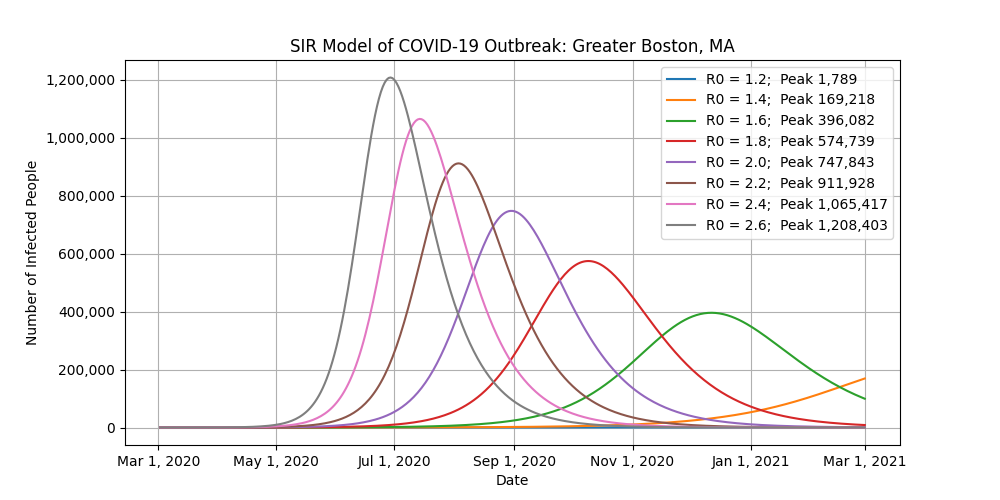
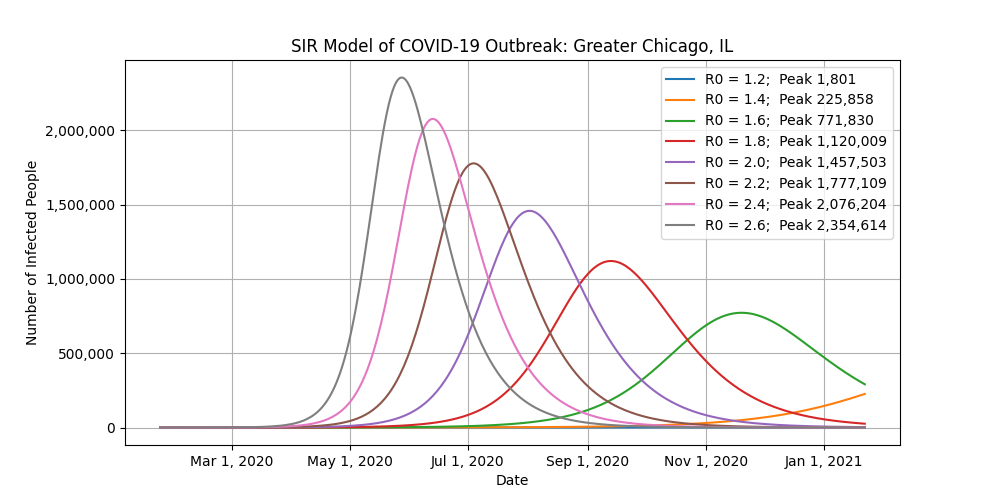
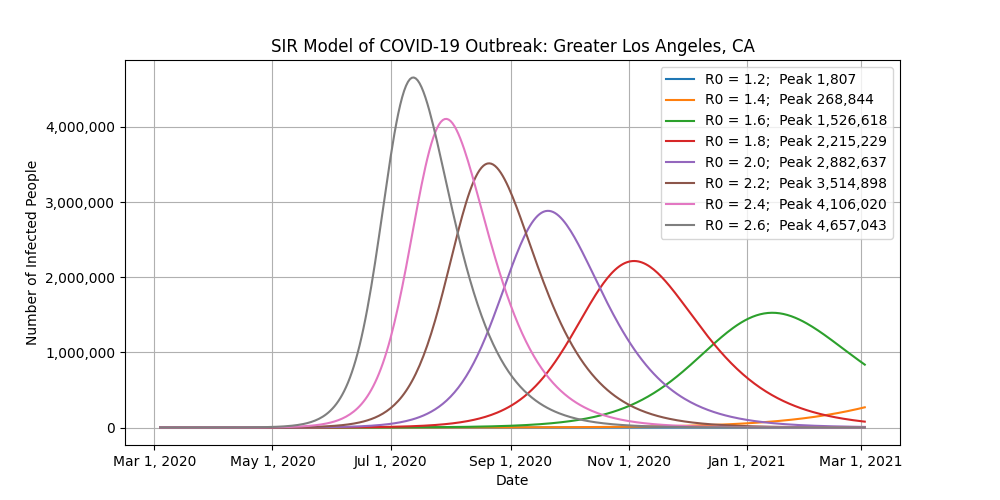
- These models consider the population of each metro area, which include the main city plus all of its suburbs.
- The R0 values on the plots are fixed for each run. In the real world, the R0 values will start high and then drop as restrictions are enacted.
- The high number of undetected or asymptomatic cases will help keep the R0 value of COVID-19 high.
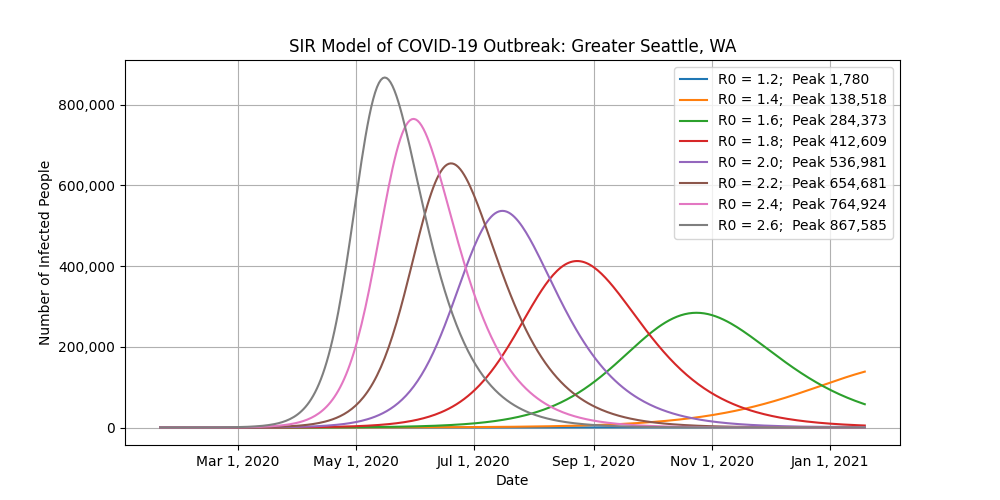
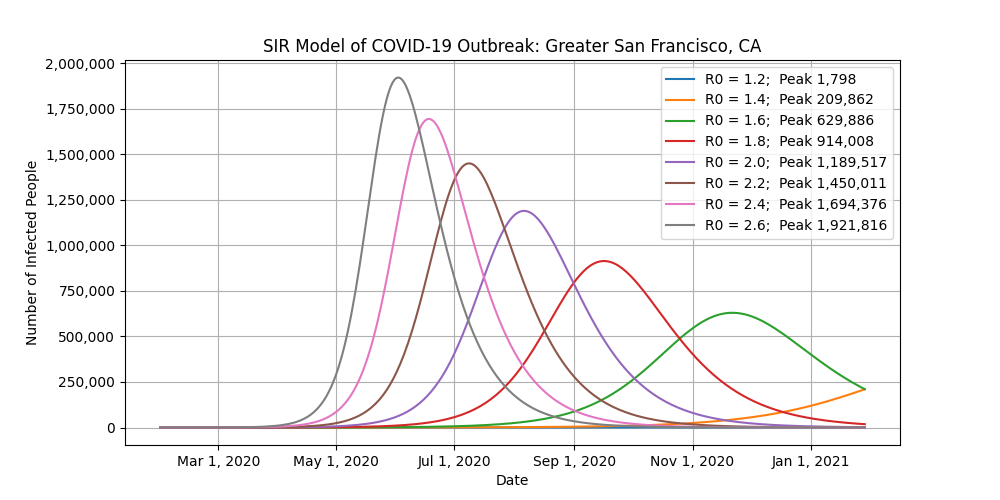
- The “Peak” label in the legends refers to the number of infected people at the peak of the outbreak for that scenario.
- You want to focus on the number of infected people at the peak of each scenario. Do not worry about the exact dates of the peaks of the outbreaks.
- As you look at those peak values, think of how you can help with social distancing to reduce R0.
- The current R0 value of the coronavirus in the United States is about 2.3, according to the federal government. That means that every infected person spreads the disease to an average of 2.3 other people. For comparison, the seasonal flu has an R0 value of 1.3.
- I don’t know what the hospital capacity is in each city, but for reference New York State (read: the whole state, not just NYC) has 54,000 hospital beds and 3,100 ICU beds.
- When the city of Wuhan, China enacted their total lockdown in January, the R0 value dropped from 2.35 to 1.05 in less than a week. You won’t see R0 drops this drastic in the United States. However, the goal to get R0 as low as possible remains the same.
SIR Model Outputs for Several US Cities
Conclusion
For this pandemic, I will say the same thing I say before just about every major weather disaster. Please heed your local, state, and federal government’s warnings. I can’t stress this enough. In a weather disaster, you’re only putting your own life at stake by being stupid. In a pandemic, you’re putting the lives of every one else who’s around you at stake as well.
I understand we are a society that rewards stupidity. If we all work together, there is still time to slow this thing down, but that window will slam shut in just a matter of a few days. All quarantining yourself from knowledge and common sense does is keep that critical R0 value high and put more lives at risk. I’ll leave you with one final plot of COVID-19 data comparing the US cases to Italy’s. This is actual data and is not generated by any models. Stay tuned for more updates.
