In today’s media-rich internet, load times are critical to your web application’s success. There is no industry for which that rings true more than the online mapping and GIS community. In the past, even small to medium-sized datasets were notorious for crippling web-based GIS applications and crashing web browsers. Thankfully, the leaders of the online GIS community have come up with a solution that I used to reduce data usage in my COVID-19 Map by 99.92%. And that’s just for one country. Today, you’re going to learn how to achieve similar results by setting up region mapping in Terria.
What is Region Mapping?
Region mapping is the process of using unique identifiers to map a dataset to a separate map geometry. While this geometry can be any polygon, line, or point on a map, it is most often some kind of physical or political boundary, ranging from state and country borders down to census tracts, neighborhoods, and property lines. The benefits of region mapping are profound for web-based GIS applications such as Terria and Cesium.
- Load map geometries once in region mapped datasets vs every data point in datasets that do not use region mapping
- In Terria, your dataset is stored in CSV format, which can opened with everyday tools such as Microsoft Excel
- Vector tiles used in region mapping are typically between 1% and 10% the size of most other GIS formats, including Shapefiles, GeoJSON, and KML/KMZ.
- Reuse vector tilesets over multiple datasets to easily scale your application up and down. The geometries I use to track COVID-19 can be reused to track weather, elections, Census data, population, and more.
- Region mapping only loads the visible part of the map geometry in Terria. Without vector tiles, you must load the entire geometry, regardless of whether or not it’s visible.
Region Mapping Performance in Terria
So just how much of a performance boost do you get using region mapping? Let’s look at the actual performance of loading the geographies of the Canadian provinces that we use in our COVID-19 map. Keep in mind that these numbers are for loading the geometry only. They do not load any COVID-19 data.
| Parameter | GeoJSON | Region Mapping/Vector Tile |
|---|---|---|
| Entire Geometry Size | 141 MB | 26 MB |
| Whole Country Overview on Map | 141 MB | 643 kB |
| Whole Country Overview Load Time (100 mbit/sec) | 11.28 sec | 0.05 sec |
| Provincial Overview: Ontario | 141 MB | 281 kB |
| Ontario Overview Load Time (100 mbit/sec) | 11.28 sec | 0.02 sec |
As you can see, the region mapping wins hands down. This effect only gets compounded once you add the COVID-19 data. If you’re not using region mapping, the map geometry needs to be loaded for every data point you have. When you take that 141 MB GeoJSON and multiply it by 550-plus days of the pandemic, you’re looking at about 70 GB of data for just the geometry alone! And that number gets bigger with each day that passes. With region mapping, you only load the 643 kB of geometry to see the overview of Canada, regardless of how many days the pandemic drags on for.
I do want to point out that GeoJSON currently does not support time-series data. However, if you convert it to a format that does, such as CZML, you’re still looking at similar sizes and load times for the geometry.
What You’ll Need to Set Up Region Mapping in Terria
The Terria developers have thankfully made it very easy to set up region mapping. You’ll need a few tools to do it.
- Your map geometry, in either GeoJSON format or a format that can be easily converted to GeoJSON, such as an Esri Shapefile.
- A means to convert your geometry to GeoJSON. I recommend either a GIS program or Python GeoPandas.
- Your favorite text editor
- [Optional] Python, if you want to automate the process. We’ll cover automating this process in detail in a future tutorial.
Step 1: Configure Your GeoJSON or Shapefile
Before we convert our GeoJSON into vector tile format, we need to make sure each feature has the necessary parameters for region mapping. At the very minimum, each feature needs to have a feature ID and a unique ID that can easily identify it.
Set a Numeric ID for Each Feature in the GeoJSON
The feature ID is simply an incremental number starting at zero or one. We’ll use the feature ID to tell Terria the correct order that each feature appears in the vector tileset. Without this feature ID, your features will not display the correct dataset on the map unless they are in numerical or alphabetical order based on your ID. For example, let’s stick with the COVID-19 data and look at US States. Your GeoJSON is in alphabetical order by state name, and you’re using the 2-letter postal abbreviation as the unique ID.
Here’s where things go awry without a feature ID. If your GeoJSON is in alphabetical order by state name, Maine comes before Maryland. Likewise, Maryland comes before Massachusetts. However, using the postal abbreviations, that order changes. Massachusetts (MA) comes first, followed by Maryland (MD), and then Maine (ME). Because you specified the postal abbreviations as the unique ID for region mapping, Terria assumes that they are in alphabetical order by postal abbreviation. However, you have actually set them in alphabetical order by state name.
As a result, Terria will incorrectly determine that Maine’s data belongs to Massachsetts and vice-versa. If you clicked on Maine on the Map, the data table would be labeled as Maine, but it would actually display Massachusetts’ data. With a feature ID, you can actually tell Terria that the correct order of postal abbreviations is ME, MD, and then MA. We’ll circle back to this shortly.
Once you get your GeoJSON into the order that you want it to be in, go through an assign an incremental Feature ID to each feature in the GeoJSON. If you’re using the US States in alphabetical order by name, Alabama would be 1, Alaska would be 2, Arizona would be 3, and so on.
Include a Unique Identifier You’ll Use in Your Datasets
You’re more than welcome to use your Feature ID in the datasets. However, I really don’t recommend doing that because you won’t be able to remember them. Instead, assign them a standardized ID, such as an ISO, FIPS, or postal code. Let’s say you want to plot some data for the New England States. If you had to update the dataset several years down the road, which identifiers would be easier to recognize when you open the data file?
- ME, NH, VT, MA, RI, CT
- 21, 30, 46, 19, 39, 7
Interestingly, there’s still a problem using just the postal abbreviations as your unique identifier. What happens if you’re working across multiple countries? You’re bound to run into a conflict at some point where two countries use the same abbreviation. Take Massachusetts as an example. There are 23 countries that use “MA” as a state or provincial abbreviation.
To avoid those conflicts, simply use the ISO 3166-2 codes to identify each state. The ISO codes are standardized worldwide and prepend the 2-letter country abbreviation to the state or province abbreviation to make it a unique identifier worldwide. Even if you only plan to operate in just one country, you should still use the ISO codes. You never know when you may need to expand.
| ISO 3166-2 Code | State or Province | Country |
|---|---|---|
| US-MA | Massachusetts | United States |
| ES-MA | Málaga | Spain |
| BR-MA | Maranhão | Brazil |
| CD-MA | Maniema | Dem. Republic of Congo |
| JO-MA | Al Mafraq | Jordan |
Our Recommended GeoJSON Configuration
Our region mapping files consist of four properties.
- Feature ID
- ISO Code or other standardized unique identifier
- Unique numerical identifier that’s tied to our master geodatabase
- The feature or entity’s name
We include two unique identifiers because it gives us flexibility in how we structure our datasets. While we primarily use the standardized identifier, there are certainly instances where it’s more beneficial to use the once that’s directly linked to our master geodatabase. If you aren’t using a master database, by all means omit that property.
When you put it all together, here’s an example of what the properties for Massachusetts look like in our GeoJSON.
{
    "FID": 19,
    "iso3166_2": "US-MA",
    "state_id": 4239,
    "name": "Massachusetts"
}
Step 2: Convert the GeoJSON to Mapbox Vector Tile Format
To convert the GeoJSON file to vector tile format so you can use it for region mapping in Terria, you’ll need to use a tool called Tippecanoe. Mapbox created Tippecanoe specifically for converting GeoJSON files to vector tiles, but it comes with a catch. It’s Unix based, so it only runs on Mac OS or Linux. It does not work on Windows. You can install Tippecanoe for free from GitHub.
Once you have Tippecanoe installed, it only takes one command from your command line to generate the vector tiles. We use the following command to generate vector tiles of state and provincial boundaries:
tippecanoe -z10 -e states --drop-densest-as-needed mexico-states.geojson -l mxstatesSo what does this all mean? Let’s break it down. Please consult the Tippecanoe documentation or reach out to us for further details. We strongly recommend you standardize your naming conventions across all vector tile properties so they’re consistent and easy to reference in the future.
| Command | Meaning |
|---|---|
tippecanoe | Use the Tippecanoe program |
-z10 | Include zoom levels from 0 to 10 in the vector tile set |
-e states | Output raw vector tile files to a folder called “states” |
--drop-densest-as-needed | Drop the least visible features at each zoom level as needed to reduce file size |
mexico-states.geojson | The path to the GeoJSON we want to convert to vector tiles |
-l mxstates | The name of the layer you’ll reference in the region mapping in Terria |
Upload Your Vector Tiles to a Mapping Server
Finally, you’ll want to upload your newly created vector tiles to a mapping server. However, be aware that they will not work “out-of-the-box” if you upload them to a standard web host. However, you can configure standard web hosts to serve vector tiles. We’ll cover setting up a mapping server in a future tutorial. In the meantime, if you want to just upload your vector tiles and be done with them, put them in an Amazon S3 bucket, which is configured to serve map tiles by default.
Step 3: Create Your Region Mapping File For Terria
In this step we will create the actual map that tells Terria which unique identifiers correspond to which geometries. The region map is stored in a JSON file. Creating the region map is very prone to type-o’s and human error, so I highly recommend automating this step with Python. We’ll cover automation in a future tutorial. Before we begin, you’ll need a few items from previous steps.
- The name of the layer in your vector tiles from Step 2
- Your unique identifier from Step 1 (not the Feature ID)
- The order that each feature appears in the GeoJSON from Step 1
Remember the Feature ID we discussed in Step 1? If you followed our advice, you put the feature in the GeoJSON in numerical order by that Feature ID. To generate your region map, all you have to do is sort your GeoJSON by Feature ID and pull your unique identifiers out of the GeoJSON in that same order. It’s that simple.
Recall in Step 1 that we had a GeoJSON of US States sorted Alphabetically by state name. We used the ISO 3166-2 codes, which are based on postal abbreviations, as our unique identifier. To generate the region map, simply list the ISO 3166-2 codes for each state in alphabetical order by name. Here’s our region map showing the preserved alphabetical order of Maine, Maryland, and Massachusetts by name. I omitted the rest of the states to save space.
Example Using US State Geometries
{
    "layer": "usstates",
    "property": "iso3166_2",
    "values": [
        ...
        "US-KY",
        "US-LA",
        "US-ME",
        "US-MD",
        "US-MA",
        "US-MI",
        "US-MN",
        ...
    ]
}| Parameter | Definition | Defined In |
|---|---|---|
layer | Layer Name of the Vector Tileset, defined with the -l flag in Tippecanoe | Step 2 |
property | The key of your unique identifier you defined in the GeoJSON | Step 1 |
values | Your unique identifiers, in the exact order in which their features appear in the GeoJSON | Step 1 |
If you haven’t already, create a folder called data in the root of your Terria application. Inside that folder, create another folder called regionIds. Save your region map in that regionIds folder. You can call it whatever you want, but I recommend naming it something that you can easily identify. For the US States name it something like region_map-us-states.json.
Step 4: Create or Update Your Terria Region Mapping Configuration
Now that we’ve created our region map, we need to tell Terria both to use it and how to use it. We’ll use a JSON file to provide Terria with our region mapping configuration. Terria actually comes with a default region mapping configuration for Australia, but I find it’s much easier if we just define our own instead of trying to add to Terria’s.
First, open the data folder you created in the root directory of Terria at the end of Step 3. Inside, create a file called regionMapping.json. This file will store the region mapping configuration for our Terria application. Open the regionMapping.json file in your favorite text editor. You’ll paste a key/value pair into it for each vector tileset you wish to use for region mapping. Set the keys so they’re easy to identify. In our COVID-19 map, we use keys such as US_STATES, US_COUNTIES, CA_PROVINCES, and WORLD_COUNTRIES.
Example Using US State Geometries
{
    "US_STATES": {
        "layerName": "usstates",
        "server": "https://yourmaptiledomain.com/us-states/{z}{x}{y}.pbf",
        "serverType": "MVT",
        "serverMinZoom": 0,
        "serverMaxNativeZoom": 3,
        "serverMaxZoom": 10,
        "regionIdsFile": "data/regionIds/region_map-us-states.json",
        "regionProp": "iso3166_2",
        "aliases": ["ISO3166_2", "US_STATE_ID"],
        "description": "US States",
        "bbox": [
            -179.999999999999,
            18,
            179.999999999999,
            72
        ],
        "nameProp": "name"
    }
}| Parameter | Definition | Defined In |
|---|---|---|
layerName | Layer Name of the Vector Tileset, defined with the -l flag in Tippecanoe | Step 2 |
server | The URL to your map tile server | Step 2 |
serverType | Set to “MVT”, which stands for Mapbox Vector Tiles | N/A |
serverMinZoom | The minimum zoom we defined when we created the vector tileset in Tippecanoe | Step 2 |
serverMaxNativeZoom | The maximum zoom level the server supports natively | N/A |
serverMaxZoom | The maximum zoom we defined when we created the vector tileset in Tippecanoe | Step 2 |
regionIdsFile | Path to the region map JSON file | Step 3 |
regionProp | The key of your unique identifier that you defined in the GeoJSON | Step 1 |
aliases | Additional column headers in your dataset that Terria will recognize as your unique identifier. If you want the Terria’s drag and drop feature to work, one of these must be set to a unique value. | Step 1 |
description | Description of your region map | N/A |
bbox | Bounding box that contains the map geometry, in degrees of latitude and longitude. It has the format [west, south, east, north]. | N/A |
nameProp | The key of the GeoJSON feature’s property that contains the feature’s name | Step 1 |
Step 5: Link Your CSV Data to the Region Map in the Terria Initialization File
The final step completes the link between your dataset and the vector tiles. We’ll update your initialization file to tell Terria which region map to use for each dataset in your catalog. You can find your initialization files in Terria’s init directory. All you have to do is add your CSV dataset to your initialization file. At the very minimum, you’ll need the following.
{
    "name": "United States: COVID-19 by State",
    "type": "csv",
    "url": "data/us-covid19-by-state.csv"
    "tableStyle": {
        "regionVariable": "iso3166_2",
        "regionType": "US_STATES",
        "dataVariable": "New Cases",
        "columns": Outside the Scope of this tutorial; Refer to Terria Documentation
    }
}| Parameter | Definition | Defined In |
|---|---|---|
name | The name under which your dataset will appear in Terria’s data catalog | N/A |
type | Set to “csv” because your data is in CSV format | N/A |
url | The URL where the CSV file containing your data is located | N/A |
tableStyle.regionVariable | The key of your unique identifier that you defined in the GeoJSON | Step 1 |
tableStyle.regionType | The key of our region map in the Terria Region Mapping configuration | Step 4 |
tableStyle.dataVariable | The header of the column that contains the data you want Terria to display when it initially loads your dataset | N/A |
tableStyle.columns | Data formatting that’s outside the scope of this tutorial. Please consult the Terria documentation for details. | N/A |
If you’ve set everything up right, you’ll see each state get colored in when you use the ISO 3166-2 codes in your CSV file.
Example CSV Snippet of COVID-19 Data
| ISO3166_2 | Date | Confirmed | Dead | New Cases | New Deaths |
|---|---|---|---|---|---|
| US-CA | 2020-07-01 | 238,681 | 6,169 | 7,449 | 87 |
| US-CA | 2020-07-02 | 246,550 | 6,265 | 7,869 | 96 |
| US-FL | 2020-07-01 | 158,997 | 3,550 | 6,563 | 45 |
| US-FL | 2020-07-02 | 169,106 | 3,617 | 10,109 | 67 |
| US-TX | 2020-07-01 | 172,386 | 2,508 | 9,255 | 50 |
| US-TX | 2020-07-02 | 179,111 | 2,547 | 6,725 | 39 |
| US-HI | 2020-07-01 | 926 | 18 | 9 | 0 |
| US-HI | 2020-07-01 | 946 | 18 | 20 | 0 |
| US-NY | 2020-07-01 | 394,079 | 32,043 | 625 | 11 |
| US-NY | 2020-07-02 | 394,954 | 32,064 | 875 | 21 |
Conclusion
Region mapping with vector tiles is the most powerful and efficient way to display massive datasets in web-based GIS platforms such as Terria and Cesium. Region mapping can seem daunting and even a little intimidating the first time you try it. Trust me, it took me a long time to figure it out, too, when I first started working with it.
If you’re struggling with region, please don’t hesitate to reach out to me personally or leave a comment below. The Terria developers are generally pretty responsive as well. Just a few small fractions of a second can be the difference between your mapping application taking off and failing. Are you willing to take that chance with slow, bloated file formats?
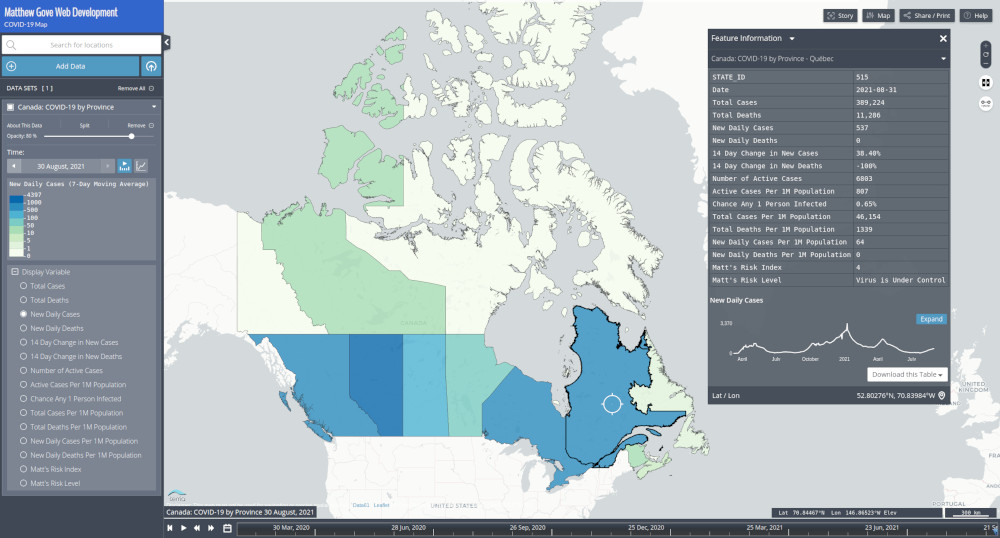
Top Photo: Region Mapping for the US, Canada, and Mexico on our COVID-19 Map
September, 2021