Well, it looks like the coronavirus has arrived in full-force here in the United States. COVID-19 will likely cause some disruptions to day-to-day life. Being a math person, the outbreak has piqued my interest in modeling and simulating some possible scenarios for the COVID-19 outbreak in the United States.
Before I begin, I do have a couple disclaimers.
- I claim zero knowledge of viruses, disease, and everything else in the medical field.
- These simulations are highly idealized and simplified. They are based solely on mathematics, and ignore many of the outside factors that are affecting the current outbreak.
How We Simulate Outbreaks
Most of my experience studying outbreaks came from watching tornado outbreaks across the Great Plains when I lived in Oklahoma. We can use the Gaussian Function to model any type of outbreak, including disease. Outbreaks most commonly follow a Gaussian Function, which is just a fancy way to say “bell curve”. A standard bell curve looks like this:

When outbreaks start, they grow exponentially until they eventually hit some kind of ceiling. With tornado outbreaks, that ceiling is when they use up all of the instability in the lower parts of the atmosphere, which cuts off the storms’ fuel supply. In the case of diseases, even if the pathogen spreads completely unchecked, it can only infect a finite number of people.
The exponential growth will start to slow down as the outbreak approaches the ceiling, or top of the bell curve. It will eventually level off, and then begin to drop. Mathematically, the Gaussian Function that defines the bell curve is:

In the context of an outbreak, the variables in the above equation are:
- a is the number of cases (the height of the bell curve) at the peak of the outbreak. It is not the total number of cases.
- b is the date/time of the peak of the outbreak
- c is the standard deviation, which is related to how long it takes to reach the peak of the outbreak. It defines the width of the bell curve. There are approximately three standard deviations in a normal bell curve.
- x is the time since the beginning of the outbreak. For the coronavirus, the time is in units of days.
A Few Numbers That Will Be Helpful For Our COVID-19 Simulations in the United States
Before we dive into the simulations, there are a few numbers that will be helpful to simulating the COVID-19 outbreak in the United States. I pulled these numbers off the internet and in no way shape or form do I guarantee that they are accurate.
Edit March 14, 2020: I made an error in my calculations that led to incorrect numbers below. I corrected them in the list below, but the plots still show incorrect values. In those examples, I am just demonstrating the concepts and the actual values are not hugely important.
- The population of the United States is approximately 330 million
- There are 2.4 hospital beds per 1,000 people in the US
- This works out to
7.92 million792,000 hospital beds total - Approximately 20% of the COVID-19 cases require hospitalization.
- This means it will take approximately
39.6 million3.96 million cases, or12%1.2% of the population getting sick to overwhelm the hospital system in the US.
Setting Up the Simulations
We will be writing and running the simulations for several different scenarios with Python. For each scenario, we will input
- The total number of cases (number of people who contract the disease) at the peak of the outbreak
- The average number of days it takes for the number of cases to double. In the real world, this number is constantly changing, which makes modeling the outbreak tricky.
The model can use this data to predict the peak of the outbreak will occur and how long the outbreak will last.
A Worst-Case Scenario
For the first simulation, let’s consider a hypothetical worst-case scenario where COVID-19 spreads unchecked throughout the United States. In this scenario, there are 100 million cases at the outbreak’s peak. The number of cases double every 3 days.
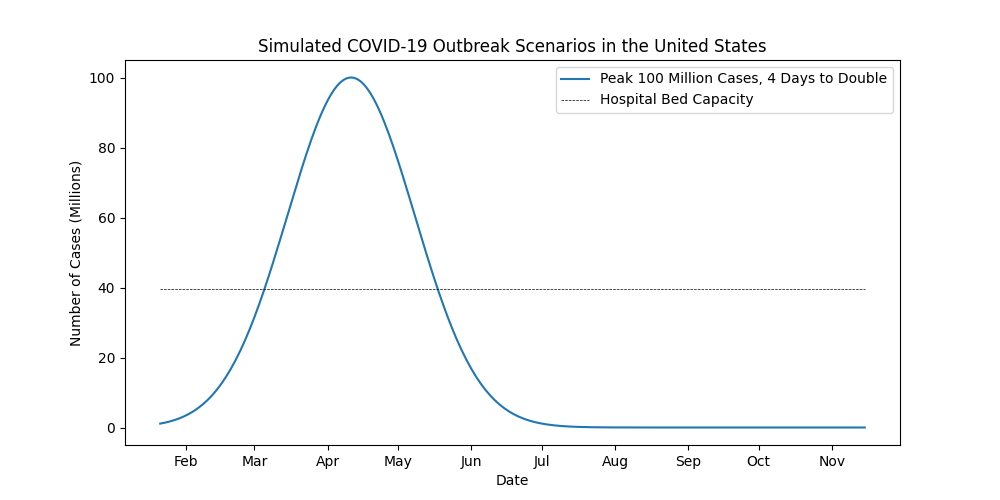
You can see the virus rapidly spreads, quickly overwhelming the country’s hospital system in early March before peaking in mid-April. Once you get over the hump, cases also decline rapidly. The odds of this scenario playing out are extremely unlikely.
So how do you control the bell curve? Health officials want to do two things:
- Reduce the amplitude of the bell curve (fewer cases at the peak of the outbreak). This reduction will hopefully lead to fewer total cases over the course of the outbreak.
- Slow the spread of the disease to prevent overwhelming the hospital system (widening the bell curve).
These goals are accomplished through measures that can include
- Travel Bans
- Quarantine and Isolation
- Banning Mass Gatherings
- Increased Cleanings of Public Places
- The general public taking precautions such as working from home, washing/disinfecting their hands, and cancelling travel plans.
We are beginning to see a lot more of these measures implemented in the US this week.
Slowing the Spread of COVID-19 in the United States
Now, let’s consider another hypothetical scenario where those measures are taken to control the spread of the disease. Officials are able to contain the disease to 35 million cases at the peak of the outbreak. They also slow the spread of the disease so the number of cases doubles every 8 days.
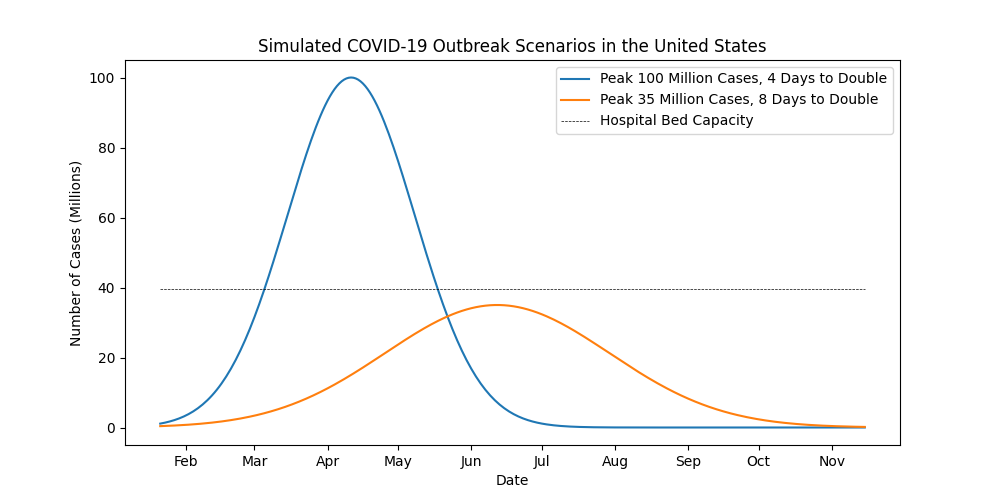
While the total number of cases (the area under the curve) is similar for both scenarios, you can see that in the second case (orange line), the outbreak does not overwhelm the hospital system. The trade-off is that the outbreak in the second scenario lasts longer, peaking in mid-to-late June. If that’s what it takes to save lives, so be it.
How Does The Number of Cases at the Peak of the Outbreak Affect the Date the Outbreak Peaks?
Amazingly, if you hold the number of days it takes for cases to double constant, there is not a significant difference in the date the outbreak peaks, regardless if the outbreak peaks at 10 million cases or 100 million. This will be important when we make some “real-world” predictions. Consider some more hypothetical scenarios.
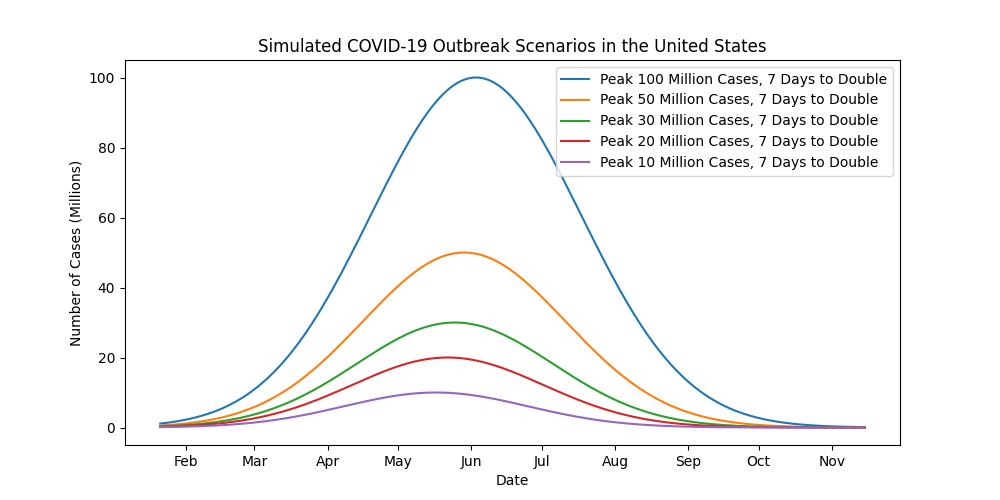
You can probably see in the graph that an outbreak peak with 10 million cases occurs around May 15-20, while the peak of an outbreak with 100 million cases occurs shortly after June 1st. That’s only a difference about three weeks.
How Could This Play Out In The Real World?
I approach this question very cautiously. Please remember that these simulations are very idealized and simplified. They are based solely on mathematics, and do not account for many outside factors that affect the current outbreak.
To try to figure out the most realistic simulation for the United States, we must look at the ongoing outbreaks in Italy and South Korea. In both of those countries, the number of cases doubled every 5-6 days. Early indicators show the doubling rate to be the same in the United States.
Because of so many unknowns, we will look at a number of different scenarios with regards to the number of cases at the peak of the outbreak. The total number of cases in both Italy and South Korea is around 10,000. Since both countries are much smaller than the US, let’s look at scenarios for the outbreak peaking at 10,000 up to 100 million.
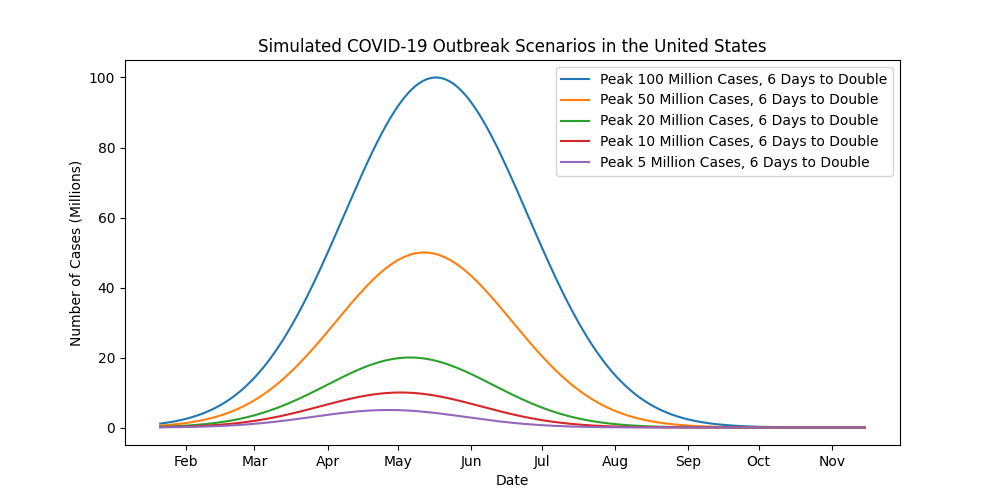
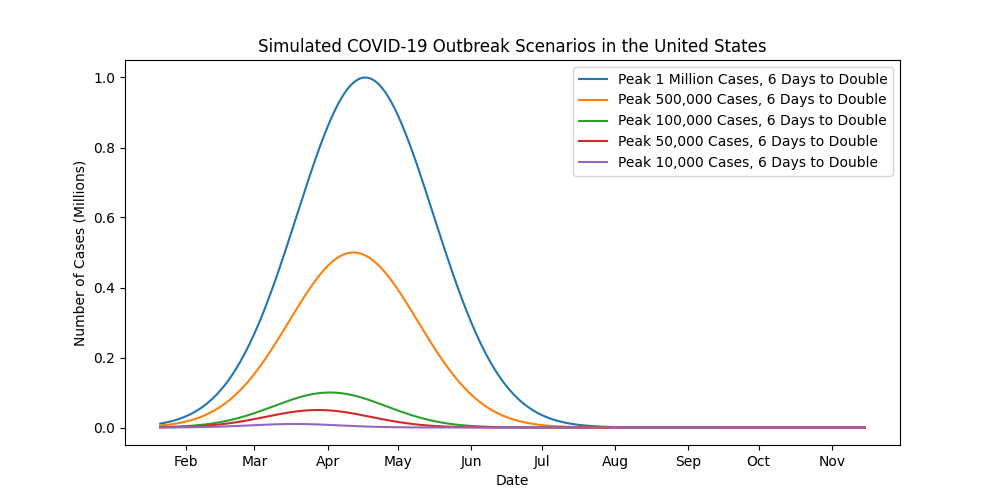
Based on some of the numbers I’ve heard the health experts throwing around, here are a few possible outcomes. Remember that the number of cases at the peak of the outbreak is less than the total number of cases over the course of the entire outbreak.
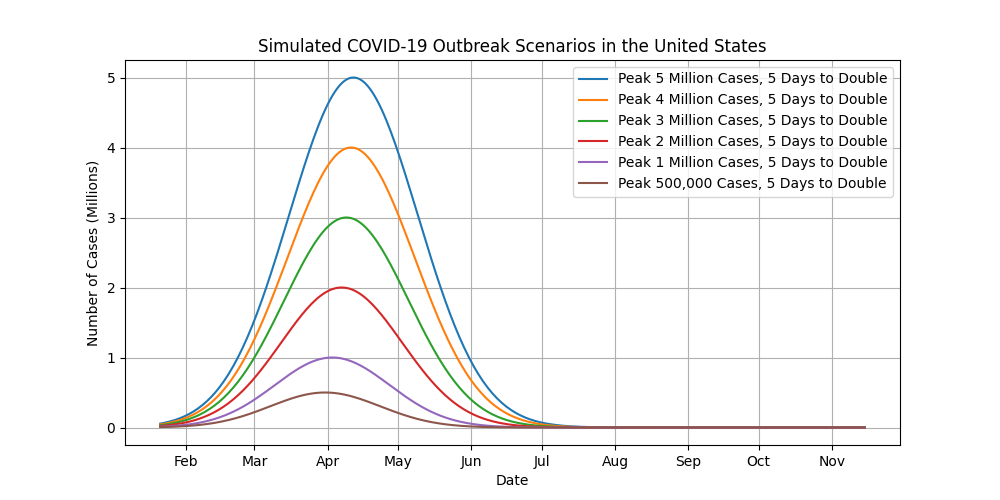
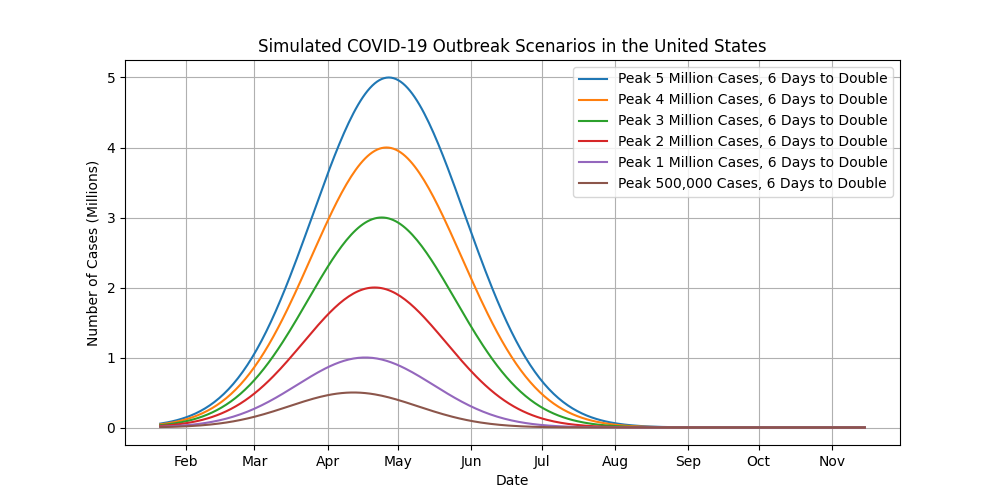
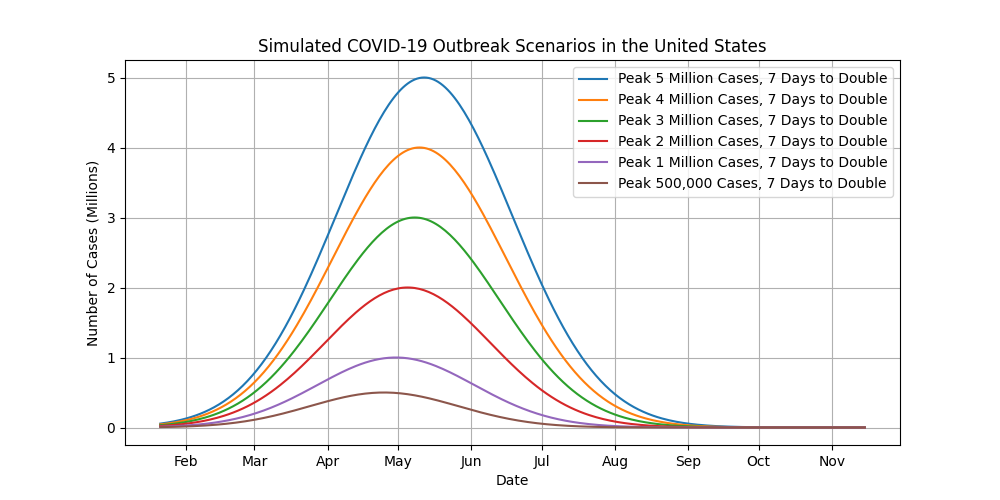
Again, please take the results of these simulations with a grain of salt. There are so many unknowns about this outbreak that it is impossible to accurately predict what will happen with such a simple, idealized model. Based on what I’ve observed with the coronavirus outbreaks in other countries coupled with the mathematics of the Gaussian Function simulations, it wouldn’t surprise me if we were close to the peak of the outbreak, if not past it, by the time we get to into May. But then again, given the uncertainty of everything, those guesses could be way off too.
Until then, buckle up. It’s gonna be a bumpy ride. Next time, we’ll look at some of the same predictions using the SIR Model.
P.S. If any of you are interested, here is the Python code that generated the plots in this post.
#!/usr/bin/env python3
import numpy as np
import matplotlib.dates as mdates
import matplotlib.pyplot as plt
import math
import datetime

# Important Numbers:
# US 2.4 Hospital Beds Per 1000 People
#   --> ~ 792,000 beds total
#   --> ~ 3.96 million cases to overwhelm system
# US Population 330 Million
# Approx 20% of COVID19 Cases Require Hospitalization
# First arrival in United States January 21, 2020

class Covid19Scenario(object):

    def __init__(self, number_infected, days_to_double):
        self.number_of_people_infected = number_infected
        self.days_to_double = days_to_double
        self.peak_day = self.days_to_reach_peak()

    def days_to_reach_peak(self):
        day = 0
        xt = 0
        x0 = 1
        r = 1 / self.days_to_double
        while xt < self.number_of_people_infected / 2:
            xt = math.floor(x0 * (1 + r)**day)
            day += 1
        return day


# Initialize Variables and Parameters
day_zero = datetime.datetime(2020, 1, 21)
t = np.arange(0, 300)
t_dates = [day_zero + datetime.timedelta(days=int(x)) for x in t]

# Define Scenarios
days_to_double = 7

all_scenarios = [
    Covid19Scenario(100e6, days_to_double)
    Covid19Scenario(50e6, days_to_double)
    Covid19Scenario(20e6, days_to_double)
    Covid19Scenario(10e6, days_to_double)
    Covid19Scenario(5e6, days_to_double)
    Covid19Scenario(4e6, days_to_double)
    Covid19Scenario(3e6, days_to_double)
    Covid19Scenario(2e6, days_to_double)
    Covid19Scenario(1e6, days_to_double)
    Covid19Scenario(5e5, days_to_double)
]

legend_data = []
plt.grid(True)

for scenario in all_scenarios:
    a = scenario.number_of_people_infected      # Height of Bell (Number of Cases)
    b = scenario.peak_day                       # Position of Center of Peak (Day of Outbreak)
    c = scenario.peak_day / 3                   # Standard Deviation (Width of Bell) [Days]
                                                # Note: There are 3 std devs under normal bell curve

    n = (a * np.exp(-(t-b)**2 / (2*c**2))) / 1e6
    if scenario.number_of_people_infected >= 1e6:
        legend_lbl = "Peak {} Million Cases, {} Days to Double".format(
            int(scenario.number_of_people_infected/1e6),
            scenario.days_to_double
        )
    else:
        legend_lbl = "Peak {:,} Cases, {} Days to Double".format(
            int(scenario.number_of_people_infected),
            scenario.days_to_double
        )
    p, = plt.plot(t_dates, n, label=legend_lbl)
    legend_data.append(p)

# Plot Hospital Capacity
date_format = mdates.DateFormatter("%b")
capacity_line = [3.96 for x in t]
# p, = plt.plot(t_dates, capacity_line, 'k--', linewidth=0.5, label="Hospital Bed Capacity")
# legend_data.append(p)

ax = plt.gca()
ax.xaxis.set_major_formatter(date_format)
plt.legend(handles=legend_data)

fig = plt.gcf()
fig.set_size_inches(10, 5)

plt.title("Simulated COVID-19 Outbreak Scenarios in the United States")
plt.xlabel("Date")
plt.ylabel("Number of Cases (Millions)")
plt.savefig("figs/scenario-5-to-10-{}-double.png".format(days_to_double))
plt.show()