Have you ever heard the expression “Measure Twice, Cut Once”? It’s commonly used in woodworking and carpentry. It’s a reminder to always double and triple-check your measurements when you cut a piece of wood. You’d be amazed at how many times you screw it up. Well, let me tell you about how I completely and utterly failed to do something very similar. Stupidity struck when I programmed the algorithm that QA/QC’s the raw sensor data in my Raspberry Pi weather station. I’ll also explain how I fixed the problem.
I recently logged onto my weather station to check some high and low temperatures for the month of January. While I was casually scrolling through the data, I caught something out of the corner of my eye. When I looked a little closer, I had to do a double take.
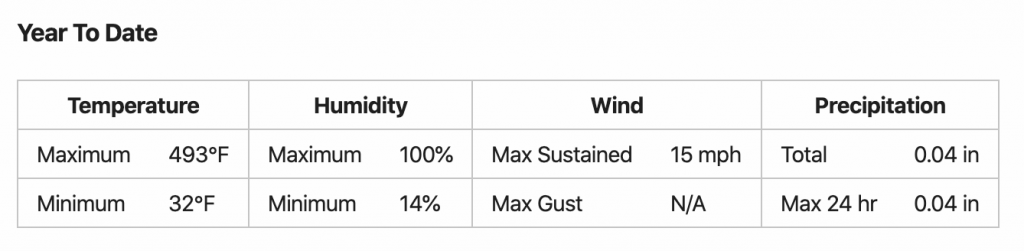
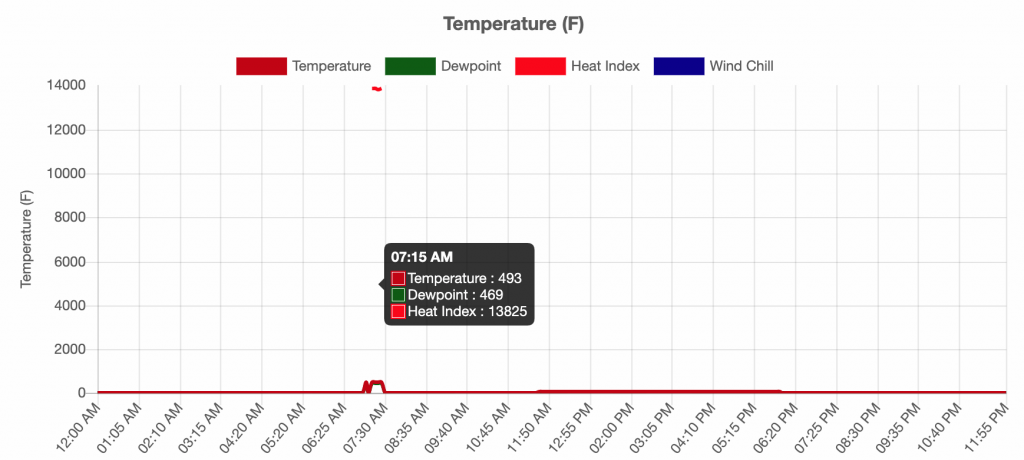
What was even more impressive were the “heat indices”. They make summers on the Persian Gulf, where heat indices can reach ridiculous levels, look like absolute zero. For comparison, the temperature of the surface of the sun is 9,941°F.
Hunting Down Bad Data Points on the Raspberry Pi
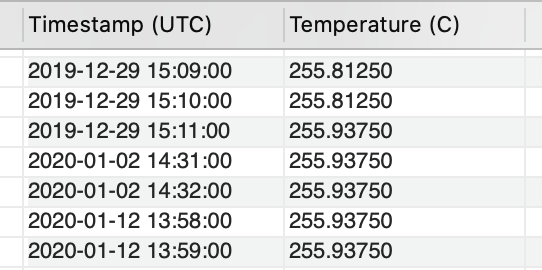
Both my and several friends’ initial reaction was to cue the jokes: “Well, it does get hot in Arizona…”, but unfortunately on a logic and reasoning test, science will beat humor every single time. Time to figure out why this happened. First, we need to run a query for all raw temperature data my sensors recorded that were greater than 60°C (140°F). I chose that cutoff based on the hottest temperature ever recorded in Arizona. On June 29, 1994, Lake Havasu City topped out at a sizzling 53°C (128°F).
Amazingly, the query returned almost 300 hits. Here is a small sample of them.
Sensors getting screwy readings like this is part of the deal when you operate any kind of data logger like this. I am much more concerned that so many bad data points managed to slip through my QA/QC algorithm on the Raspberry Pi. I’ll admit the QA/QC algorithm was the very basic one I wrote to just “get things going”. It was long overdue for an upgrade, but still, it should have caught these.
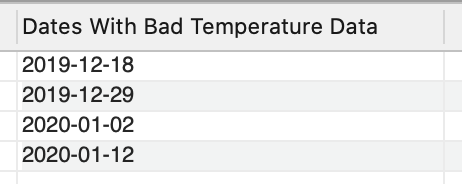
Once I queried the dates where these bad data points occurred, the culprit was revealed.
Recently Replacing the Sensor Adds a New Wrinkle
You may recall that this past December, I had to replace the analog temperature and humidity sensor that broke. I formally decommissioned the broken sensor on December 14, 2019. Did you happen to notice the first date of bad data? That’s not a coincidence.
So what caused the QA/QC algorithm to nod off and miss these bad data points? The answer goes back to the broken analog sensor. The broken sensor measured both temperature and humidity. When the relative humidity reading hiccuped, often showing values greater than 3,000% when it did, the corresponding temperature reading would get thrown off by about 10-20°C.
The problem is that 99% of those bad temperature readings were between -5 and 15°C (23 to 59°F). During the winter months, we see actual temperatures inside that range every day here in the Phoenix area, so you can’t simply filter them out. I wrote the original QA/QC algorithm to flag relative humidity values that were greater than 100% or less then 0%. I would deal with the temperature parameter when I updated the algorithm.
The New Temperature Sensor
The new digital sensor I installed only measures altitude, barometric pressure, and temperature. As a result, the Raspberry Pi reverted to obtaining its humidity data from the National Weather Service. The NWS data is already QA/QC’d. Because my original QA/QC algorithm only flagged humidity and not temperature, it deemed every data point that passed through it “OK”, thus rendering the algorithm redundant.
To confirm that this is the issue, the database puts the data that the QA/QC algorithm flags into a separate table in the sensor database. I use that data for troubleshooting and making improvements to the algorithm. A simple query will reveal the dates of temperatures I have flagged. If swapping the sensors did in fact make the QA/QC algorithm redundant, the query will only return dates on or after the sensor replacement. I replaced the sensor on December 14, 2019.
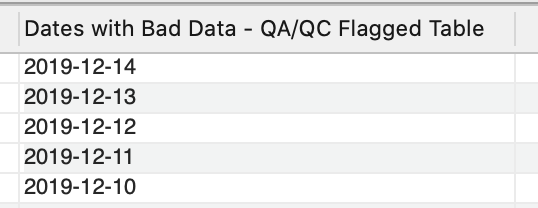
Thankfully, fixing the issue requires nothing more than a few lines of code to add an if statement to the algorithm so it flags temperatures that are outside of an acceptable range of -20 to 60°C. (-4 to 140°F). I chose the upper limit based on the hottest temperature ever recorded in Arizona (53°C/128°F). At the other end of the spectrum, I based the lower bound off of the coldest temperature ever recorded in Phoenix (-9°C/16°F). I will tweak that range as needed.
Looking Ahead
My goal is to continually add small upgrades and fixes to the QA/QC algorithm over the next year. By the time I have the complete network of sensors up and running, it will be up to a level of complexity that is acceptable for a hobby weather station. At the same time, I want it to be held as close to professional standards as I can. Stay tuned for future posts where we will look closer at what happens in the data logger’s electrical system to cause such wacky temperature readings.