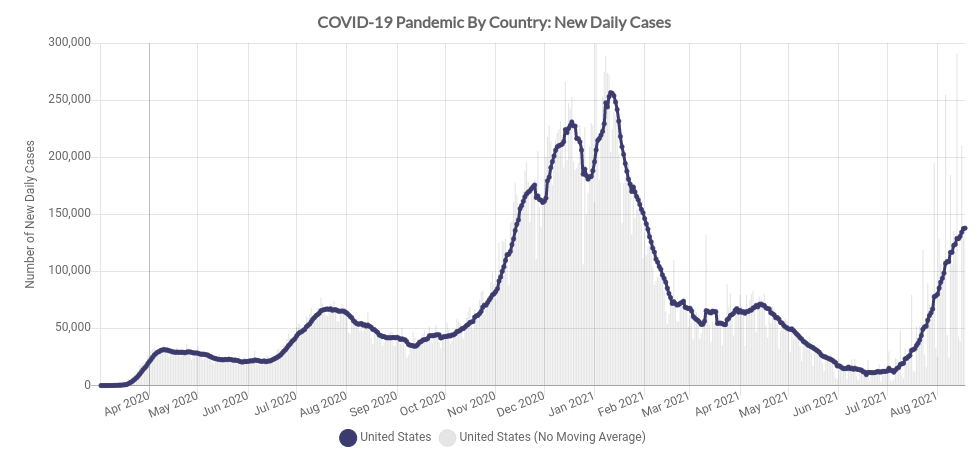
Well, that didn’t last long. Our COVID-free summer lasted all of about six weeks. Thanks to the highly contagious Delta variant that first surfaced in India last winter, COVID-19 has come roaring back in the United States. In less than a month, the Delta spike has already surpassed all of the previous waves in the US except for the awful Winter 2020-21 wave. And it’s showing no signs of letting up.
So just how bad will the ongoing Delta surge get in the United States? For that answer, we’ll once again turn to the COVID-19 models. We’ll use the same methodology as our 14 November, 2020 prediction of the winter wave. That forecast missed the peak by 1 day and 20,000 cases.
The Current State of COVID-19 in the United States
Before we dive into the models, we first need to do a full assessment of the current COVID-19 situation in the United States. It’s impossible to make an accurate forecast without seeing the actual data. We’ll start with a general overview of the whole country. The Delta variant accounts for more than 98% of all COVID-19 cases in the United States.
Next, we’ll drill down a little further and locate the current hot spots on a map. For the most detailed look, we need to look at the smallest political subdivisions we have available. In the US, we have COVID-19 data for counties.
Instead of looking at a lot of different maps, we now have a secret weapon that did not exist last fall. Prior to driving across the country back in February, I created Matt’s Risk Index. The index, which is essentially a weighted average of several key parameters, allows us to quickly and easily identify high-risk areas at any scale. But perhaps the most powerful aspect of Matt’s Risk Index is that you can model it.
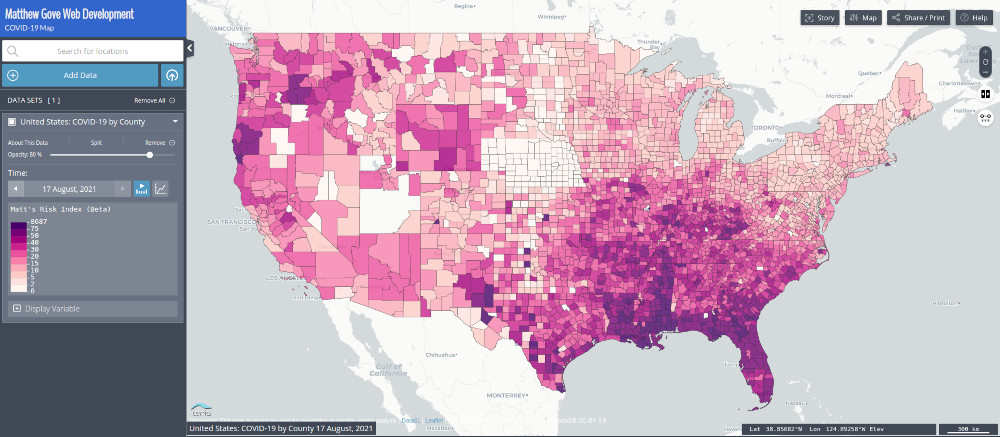
Not surprisingly, the Delta Variant is absolutely ripping through areas with low vaccination rates. The vast majority of transmission is in the southeast, but cases are really accelerating in parts of the west as well. To make matters worse, nobody seems to be all that interested in doing anything about it. As a result, cases are skyrocketing with no end in sight.
A Look Back at the Spring, 2021 COVID-19 Delta Spike in India
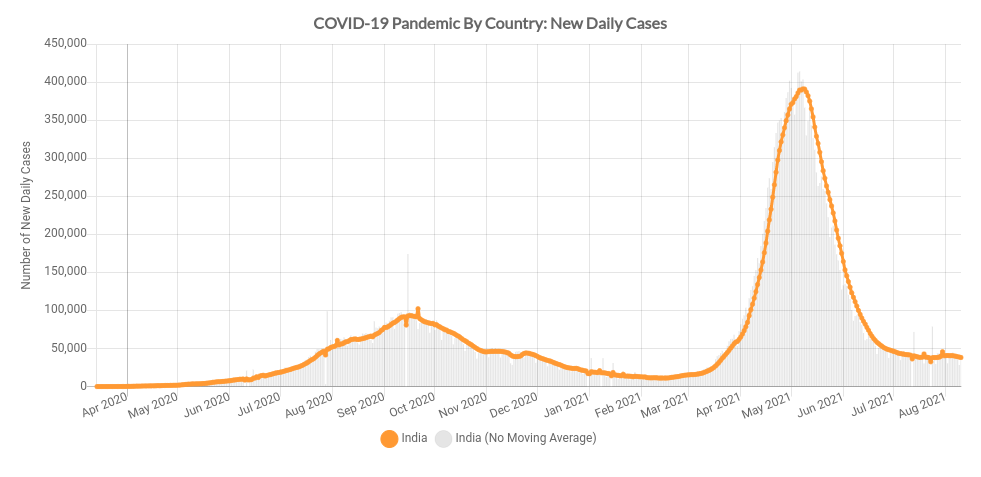
The Delta variant of COVID-19 first surfaced in India in December, 2020. It’s nearly twice as contagious as the initial strain of COVID-19. Initial data indicates it causes more severe disease, too. The good news is that all of the vaccines currently authorized for use in the United States remain highly effective against Delta.
The Delta variant smoldered in India until April, 2020. Once it took off, it wasted no time ripping through India’s 1.36 billion residents, whom were almost entirely unvaccinated at the time. In less than a month, India’s caseload increased twenty-fold, peaking at 414,188 new cases on 6 May. Initial estimates state that the Delta wave could have infected as much as 70% of India’s population.
So does India provide a glimpse into what could happen in the United States? Absolutely. Simply overlaying the current Delta surge in the United States over India’s spike from the spring tells us a lot. However, before we do that, let’s look at a few differences between India and the United States.
- The US has a much lower population and population density than India
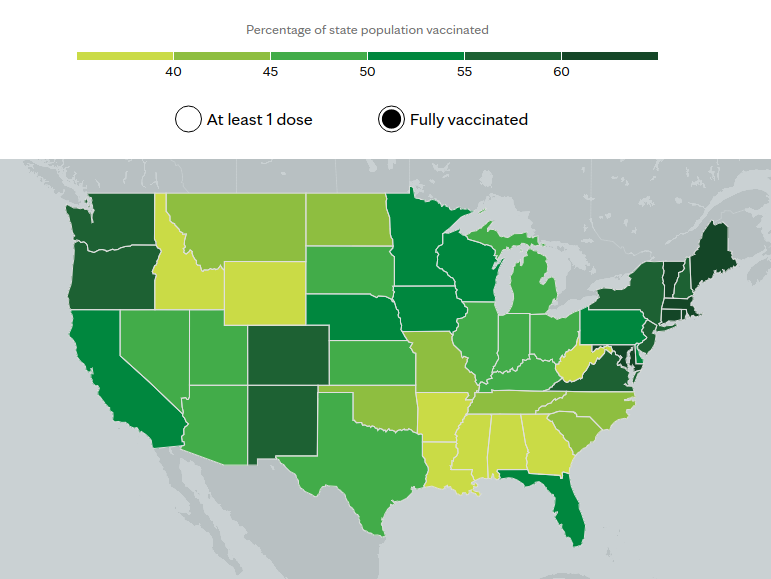
- About half of the US population is fully vaccinated. By comparison, less than 5% of India’s population was fully vaccinated when the Delta variant broke out back in the spring.
From that data along, we can make a logical hypothesis. In the United States, the Delta variant of COVID-19 will not spike as high as it did in India, but the outbreak will last slightly longer.

As you can see, new case loads in the United States closely mirrored new case loads in India at the beginning of the outbreak. However, the curves are starting to diverge due to the much higher vaccination rate in the United States.
A Quick Word About Mathematical Models
When looking at any kind of mathematical model, you need to know whether you should favor a worst-case scenario, best-case scenario, or somewhere in between. In previous forecasts, we generally stuck to a middle-of-the-road scenario. However, because nobody is doing anything to curb the spread of the Delta variant in the United States, we will weigh our forecast more towards the worst-case scenario.
Additionally, we must also consider that many virus experts have said that the Delta variant can be treated like a whole new virus, despite the fact that the vaccines remain effective against it. Thankfully, our model has a mechanism built into it to handle these scenarios.
Looking Ahead: Our COVID-19 Model
As you may recall, our COVID-19 model was built using the Susceptible – Infected – Recovered, or SIR model. Unfortunately, the SIR model does not account for multiple waves in the pandemic, and we are now into the fourth wave of COVID-19 in the United States. This does not mean that we can’t make accurate predictions of new daily cases with the model anymore. Quite the contrary, we just need to jump through a few more hoops to make it work.
To make the model work, we simply need to perform a time-shift when looking at the projected curves. All that means is that the model output will be off by a certain amount of time, so we need to slide the curve left or right on the x-axis. We do not change the shape, height, or width of the curve. We simply slide it along the x-axis. Have a look at the model output.
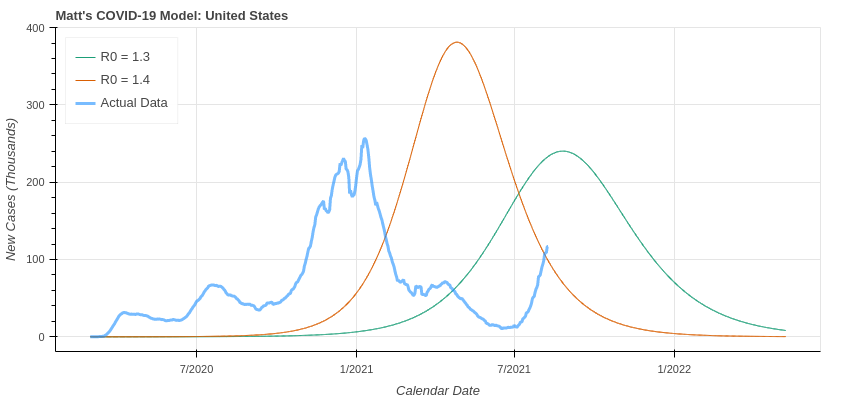
Put on Your Mad Scientist Hat…and Stay with Me
All right, full warning, you may think I’m crazy here, but trust me, there’s a method to my madness. First, compare the actual data (blue line) to the model output (orange line). The shape of the blue line starting on 1 July, 2021 closely correlates to the shape of the orange line starting on 1 January, 2021. To get the model’s projection for the current wave, just slide the orange curve to the right by six months.
Making the time shift establishes a baseline for a worst case scenario. It’s actually a worse than worst-case scenario because the raw calculation does not account for 50% of the US population being fully vaccinated. That means that it’s next to impossible for the US to reach 375,000 new daily cases in the outbreak.
To account for 50% of the US population being fully vaccinated against COVID-19, the susceptible population for the SIR model is cut in half. As a result, both the height and width of that orange spike should get cut in half as well. When you do that, the outbreak peaks at about 175,000 new daily cases and lasts about 4 months. That means that the Delta wave should peak in early September in the United States, and will be largely over by the time we get into November and December. It’s not exact, but it certainly gets us in the ballpark.
A Much More Accurate Method Exists…and It’s Been 93 to 98% Correct This Summer
I’ll be the first to admit, I wouldn’t put too much credibility into the time shifting on its own. Let’s look at the actual model predictions that I post to the COVID-19 dashboard every week. Those forecasts have gotten 93-98% of their predictions correct each run since late Spring, 2021. These number are from the 9 August, 2021 model run.
| Parameter | Value |
|---|---|
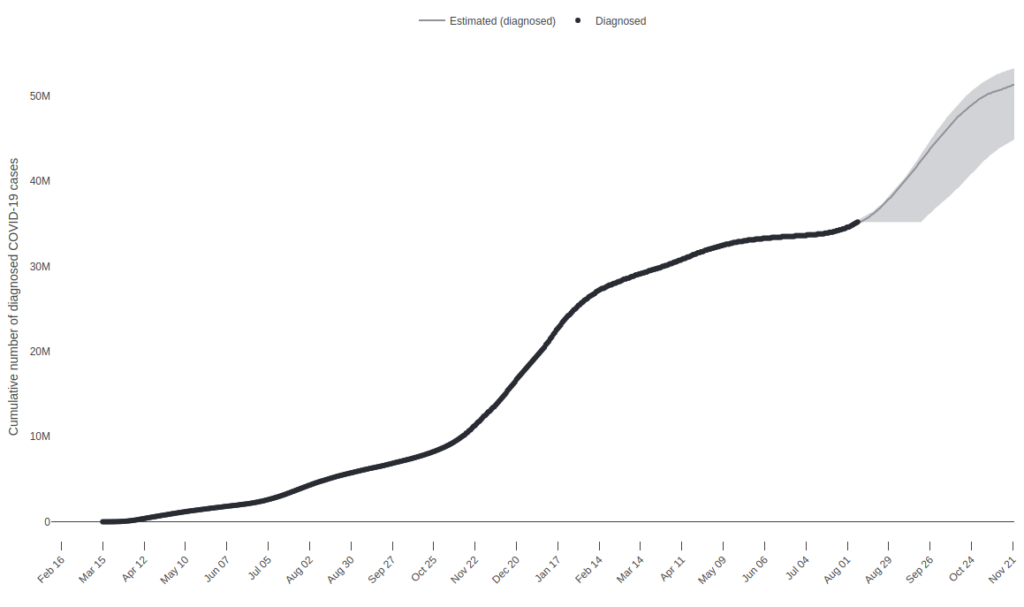
| Actual Cases – 8 August | 35,763,785 |
| Projected Cases – 23 August | 36,892,000 to 51,402,000 |
| Projected Cases – 9 September | 37,899,000 to 51,613,000 |
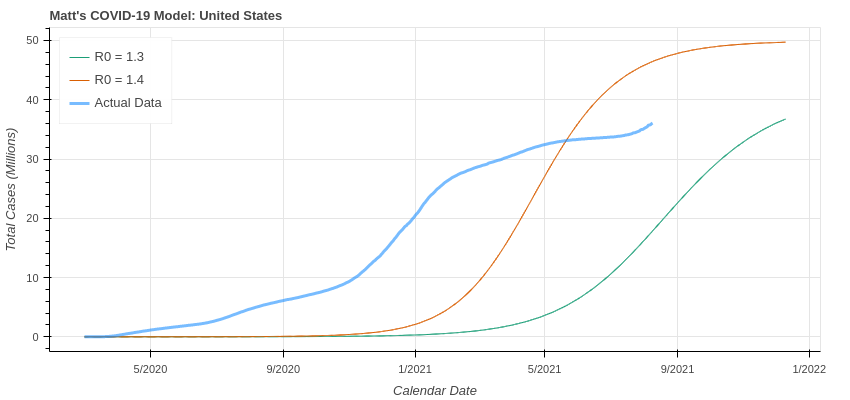
So what can we glean from this data? In the above plot, it projects that the blue line should track about half way between the orange and the green lines. The peak occurs when the curve stops accelerating upwards and starts leveling off. That leveling off happens in early September. All of a sudden the time shifting isn’t as crazy as it originally sounded!
While this projection won’t tell you anything about the daily new cases, you can get a pretty good idea of the number of cumulative cases since the start of the pandemic. If you extrapolate the blue line into the fall, the US should have around 40-42 million total cases at the peak.
Our COVID-19 Model’s Official Prediction for the Delta Wave in the United States
When you take everything we just discussed and put it all together, you get the model’s official prediction. Before even looking at other models, my gut feeling is that the peak of 175,000 new daily cases may be low. I hope I’m wrong, but I’d be much more willing to bet on 200,000 to 225,000 new daily cases in the United States at the peak.
| Parameter | Projected Value |
|---|---|
| Peak Date | Early September, 2021 |
| New Daily Cases at Peak | 175,000 |
| Total Cases at the Peak | 40 to 42 million |
| Total Cases at End of Wave | 45 to 48 million |
The IHME Model
To further improve our forecast, let’s look at the gold standard model that the White House and many others use. The University of Washington developed the Institute for Health Metrics and Evaluation, or IHME model.
The IHME model projects daily new deaths instead of new cases. However, we can take the current death rate and use it to calculate the approximate new daily case load.
total cases = 36,055,002
total deaths = 618,137
death rate = 618,137 / 36,055,002 = 1.71%
Here are the IHME’s projections for daily deaths.
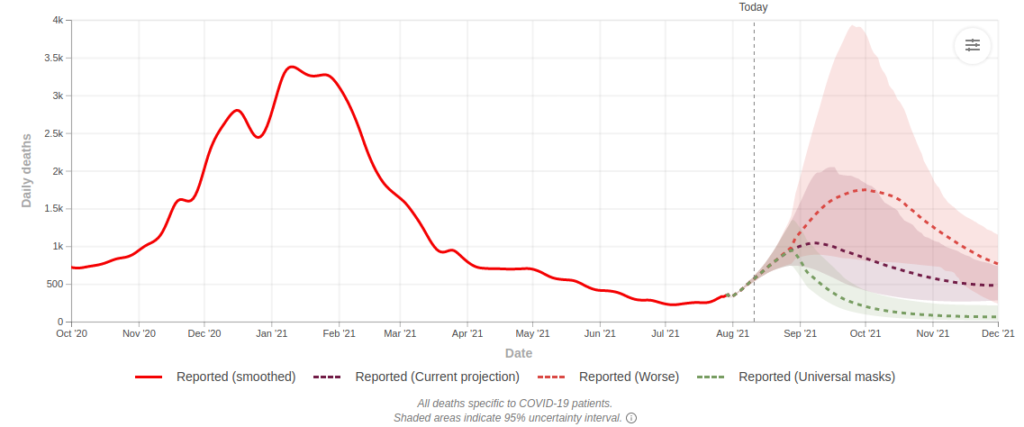
Let’s look at the worst case scenario, which is the red dashed line and shaded area. The dashed red line indicates that deaths will peak at 1,746 per day in late September. We can use the death rate to calculate the number of new daily cases at the peak.
new daily cases = 1,746 / 0.0171
new daily cases = 102,105
All right, we’ve already got a problem here. The seven day average of new daily cases in the United States surpassed 107,000 on 6 August and is still rising. The gold standard model can’t be off by that much, can it? No, it’s not. That’s why they’ve introduced the shaded areas of uncertainty. Let’s redo the calculation for the peak at the top of the shaded red area, which peaks at 3,934 new daily deaths on 25 September.
new daily cases = 3,934 / 0.0171
new daily cases = 230,058
That’s right in line with my initial prediction of 200,000 to 225,000 new daily cases. So when do cases peak in the IHME model? Simple. Cases generally peak two weeks before deaths do. Two weeks prior to 25 September is 11 September.
| Parameter | Projected Value |
|---|---|
| New Daily Deaths Peak | 3,934 |
| New Daily Deaths Peak Date | 25 September, 2021 |
| New Daily Cases Peak | 230,058 |
| New Daily Cases Peak Date | 11 September, 2021 |
The COVID-19 Simulator Model
The COVID-19 Simulator is run by Massachusetts General Hospital, Harvard Medical School, Georgia Tech, and the Boston Medical Center. It allows you to model scenarios for different variants, vaccine efficacies, restrictions, and much more.
We ran the simulation for the current mix of variants that’s circulating around the country right now. Because so little has been done to contain the Delta wave, we ran the simulation under the assumption that no new stay-at-home orders will be issued and the current levels of restrictions, which are very few, will be maintained.
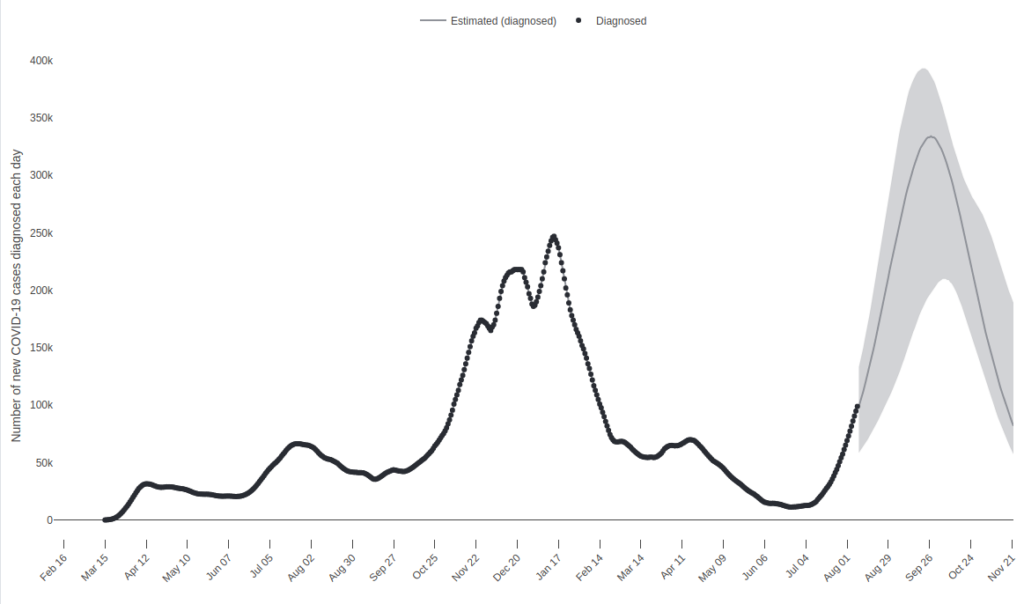
One thing stands out right away. The COVID-19 Simulator predicts noticeably higher case loads than either our model or the IHME model. It estimates the wave will peak on 27 September with 334,000 new daily cases. We first need to determine if that’s an anomaly or actually has some credibility.
Let’s see how it did in our November, 2020 forecast. At the peak of the winter wave, the COVID-19 Simulator predicted about 50,000 more new daily cases than the actual number. So it has been trending high, but certainly isn’t an anomaly. We’ll need to take that into account when we make our official forecast.
Our Official Forecast
As we do with weather forecasting, we need to determine how much weight to give each model in our official forecast. We’ll give the most weight to the IHME for two reasons. First, it’s the gold standard for COVID-19 modeling. Second, our model is largely in agreement with it. The more models you have in agreement, the higher your confidence can be. Because the COVID-19 Simulator prediction is higher, we’ll favor the higher side of the other two model projections in our official forecast.
| Parameter | Forecast Value |
|---|---|
| Peak will Occur Between | 5 to 15 September, 2021 |
| Number of New Daily Cases at Peak | 200,000 to 250,000 |
| Cumulative Cases at the Peak | 41 to 43 million |
| Cumulative Cases Post-Wave | 48 to 51 million |
Conclusion
The Delta variant of COVID-19 is a formidable foe. It’s highly contagious, and can cause very severe disease in unvaccinated people. In the United States, the Delta wave is nothing more than a self-inflicted wound, and will cause lots of unnecessary infections and deaths. Thankfully, we have one critical weapon available to us now that we lacked last fall: a safe and effective vaccine.
If you haven’t yet already, please go get your shots. It’s not too late. Not only could it save your life, it may save countless others, too. Let’s all do our part to put this pandemic behind us once and for all. Stay safe out there.
Top Photo: A Relaxing Day Rafting the Colorado River
Grand Canyon National Park, Arizona – June, 2015