On 27 October, 2021, a monster bomb cyclone hit southeast Massachusetts. The storm left an incredible path of downed trees and snapped power poles in its wake. Wind gusts on Cape Cod and the Islands very likely exceeded 100 mph. Provincetown recorded a peak gust of 97 mph before the observation stations lost power. Vineyard Haven measured a gust to 94. In fact, the minimum wind gust the National Weather Service measured on Cape Cod was 82 mph.
At the storm’s peak, over 500,000 households in southeastern Massachusetts – about 20% of the state’s population – were without power. And the power outages in those households lasted days, not hours. I’ve been through plenty monster storms on the Cape. The only storm that comes anywhere close to the 2021 bomb cyclone in Massachusetts was Hurricane Bob in 1991. After the worst of the nor’easter passed on Tuesday night, the damage was so bad crews were unable to restore power to most customers until Saturday evening.
Furthermore, I’ve witnessed firsthand both EF-5 tornadoes (Moore in 2013) and Category 5 hurricanes (Wilma in 2005) while living in Oklahoma and Florida, respectively. While the magnitude of the damage to personal property from the 2021 Massachusetts Nor’easter pales in comparisons to those storms, it did just as much, if not more damage to the power infrastructure. This fact really piqued my interest, and I really wanted to know why. Today, we’re going to dive into exactly that.
Upper-Level Meteorological Analysis of the Massachusetts Bomb Cyclone
When we look at observations, we use the same strategy as we use for model analysis. We look at the big picture first, so we can better understand what’s going on at the local level.

Two things jump out at me immediately when I look at the upper-level trough over New England. First, the trough is negatively tilted, which means that its axis tilts from northwest to southeast. Negatively tilted troughs like to “dig” to the south, which increases their magnitude. As the trough’s magnitude increases, it pulls in more energy, causing it to strengthen.
Second, the presence of strong winds on the northern side of the storm indicate there is plenty of energy for the storm to tap into. You can see this in the blue hatched area indicated greater than 40 knot winds over New Hampshire and southern Maine. Under normal circumstances, the upper-level low gets its power from the jet stream driving its southern edge. Any additional forcing on the northern edge acts to supercharge the low. If you think of the strengthening low as a car rolling downhill, the additional forcing on the northern edge is the equivalent of stepping on the gas as you go downhill.

The 2021 Massachusetts Bomb Cyclone is Born
Indeed, as the upper-level low “digs” to the south, it rapidly strengthens. Notice how much bigger the blue hatched area (>40 kt winds) has gotten over New England. As the wind on the northern side of the low increases, the low rapidly gains strength. And as the low gains strength, it increases the wind on the northern side of the storm. This positive feedback loop is what meteorologists refer to as bombogenesis. As winds circling the low increase, the pressure at the center of the low decreases. When the pressure drops 24 mb in 24 hours, you have a bomb cyclone. Indeed, observed surface pressure at Nantucket fell 28 mb in 24 hours as the storm strengthened.
Going back to the car rolling downhill analogy, the 2021 Massachusetts bomb cyclone didn’t just hit the gas. It hit the supercharger and the nitrous, too.
Surface Analysis of the Massachusetts Bomb Cyclone
So what gave this bomb cyclone not just its fuel, but its nitrous, too? A very strong warm front passed over the northeast and mid-Atlantic on Monday, 25 October. In its wake, it left unseasonably warm temperatures and high dewpoints from Virginia to Cape Cod. Widespread temperatures in the 60’s and 70’s and dewpoints in the mid 60’s gave this storm more than enough fuel, er nitrous, it needed to undergo bombogenesis.
However, there’s much more to the story at the surface than just a warm front. We’ll need to look at the surface low itself.
A Very Tilted Low Pressure System off the Coast of Massachusetts
A vertical profile of the atmosphere can tell us a lot about whether a low pressure system is expected to strengthen. If the lows are in roughly the same location as you go up, that’s called a “stacked” low, which is the system’s preferred stable equilibrium. In a stacked low, both the upper-level and low-level lows compete for the same fuel supply. At that point, the storm has reached maturity and is unlikely to significantly strengthen.
On the other hand, if the low pressure centers differ in location as you go up, that’s called a tilted low. When a tilted low occurs, it will naturally try to align itself and become stacked. However, until it does, the lows at each different height do not have to compete for the same fuel supply. While the lows try to align themselves vertically, they pull in energy. As a result, the storm strengthens. In the case of the 2021 Massachusetts bomb cyclone, it created ideal conditions for rapid intensification because of the enormous amount of fuel at the surface and the low being so heavily tilted.
Use the sliders below to see the difference in position between the surface low and the upper-level low. You’ll see the surface low centered just off of Cape Cod, while the upper level low is over Delaware. In the second frame, which was about an hour after the storm had finished bombing and had reached its peak strength, notice how much closer the surface and the upper-level lows are to each other.


Cape Cod Bears the Brunt of Bombogenesis
The positioning of the lows played a major role in the bomb cyclone hitting Cape Cod and the South Shore so hard.. Because the upper-level low is much more powerful than the surface low, it pulls the surface low into it as it tries to stack itself. Unfortunately, the surface low happened to be sitting pretty much right over Cape Cod as that happened. As a result, the surface low did not move for more than 12 hours as it rapidly strengthened. It battered the Cape with 70-80 mph wind gusts throughout the daylight hours on Wednesday.
Interestingly, that’s not the full story of why the winds were so strong. For more, we actually need to look between the surface and upper-level lows.
Mid-Level Meteorological Analysis of the Massachusetts Bomb Cyclone
Whenever you’re dealing with a strong low pressure system like the 2021 Massachusetts bomb cyclone, there’s one final ingredient to the strong winds: the low-level jet. The low-level jet is a fast-moving current of air circulating around a low pressure system, usually at 850 mb, or about 1.5 km above the surface. It’s common in low pressure systems for the low-level jet to mix down, which often brings strong wind gusts to the surface.
Indeed, if you look at the low-level jet at the peak of the storm, the strongest winds are over southeastern Massachusetts and Rhode Island. With sustained winds in the low-level jet reaching 80 knots (92 mph), it’s certainly not a surprise that the low-level jet mixing down contributed to wind gusts between 95 and 100 mph across Cape Cod and the Islands.
To determine just how likely winds in the low-level jet will mix down to the surface, let’s look at the wind shear in the lowest levels of the atmosphere. The larger the gap in wind speed between the low-level jet and the surface winds, the more likely the low-level jet is to mix down and create very gusty winds. Indeed, that’s exactly what you see, circled in the pink box on the sounding. There is a gradient of about 40 knots over the lowest 500 meters or so of the atmosphere.
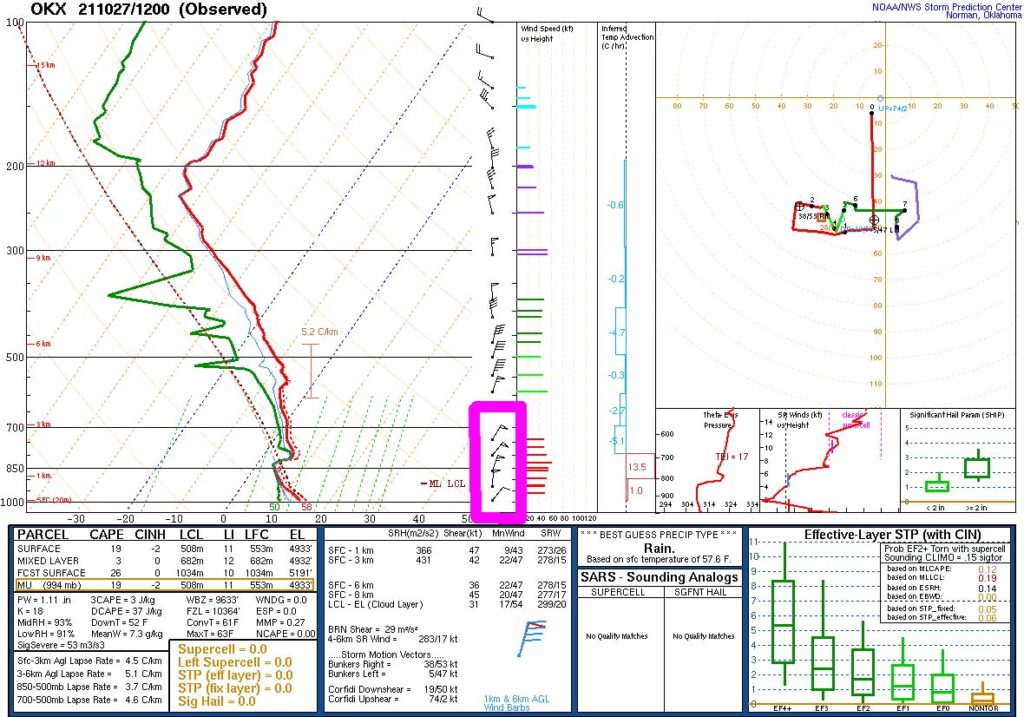
As a result, the low-level jet easily mixed down to the surface. Reports of wind gusts in excess of 80 mph poured in from southeastern Massachusetts throughout the day on Wednesday, 27 October.
Power Outages in Southeastern Massachusetts
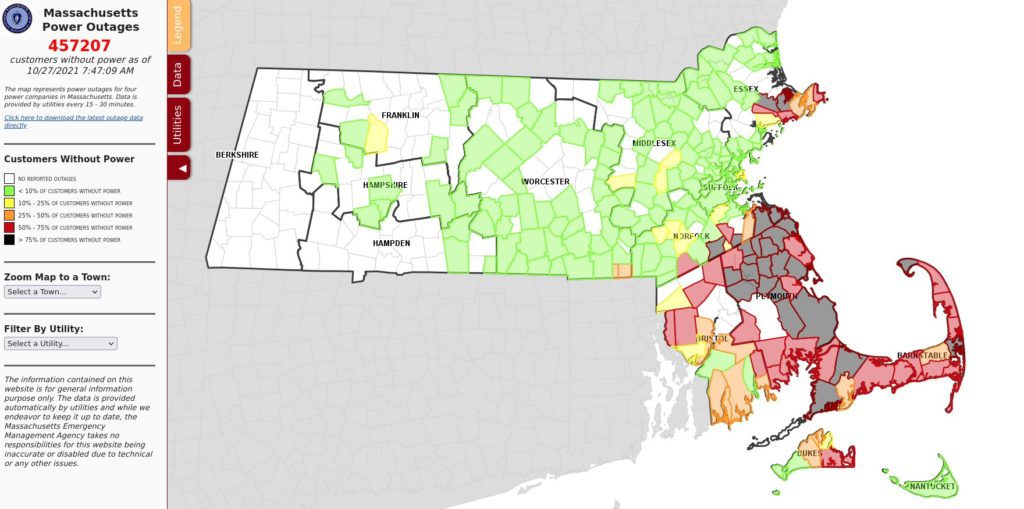
Not surprisingly, a bomb cyclone of packing gusts close to 100 mph caused power outages. What surprised a lot of people, however, was just how widespread all of those power outages were. At the peak of the storm, over 500,000 households were without power. Plymouth and Barnstable Counties were close to 100% out of power. These outages include schools, hospitals, fire and police stations, and more. The storm spared nobody.
It took utility crews 5 days to restore power to most customers. At our house in Falmouth, we lost power shortly after 2 AM on Wednesday. It didn’t come back on until 10:15 PM on Friday.
So what cause such extreme widespread power outages? Let’s start with the peak wind gusts. If you line up a map of peak winds with the map of the power outages, they overlap nearly perfectly. And keep in mind that the actual peak wind gusts were likely higher than this map shows. The power was already out at most of these stations before the worst of the nor’easter hit. I can tell you from having been in the storm, the peak gusts in Falmouth were way higher than what this map shows.
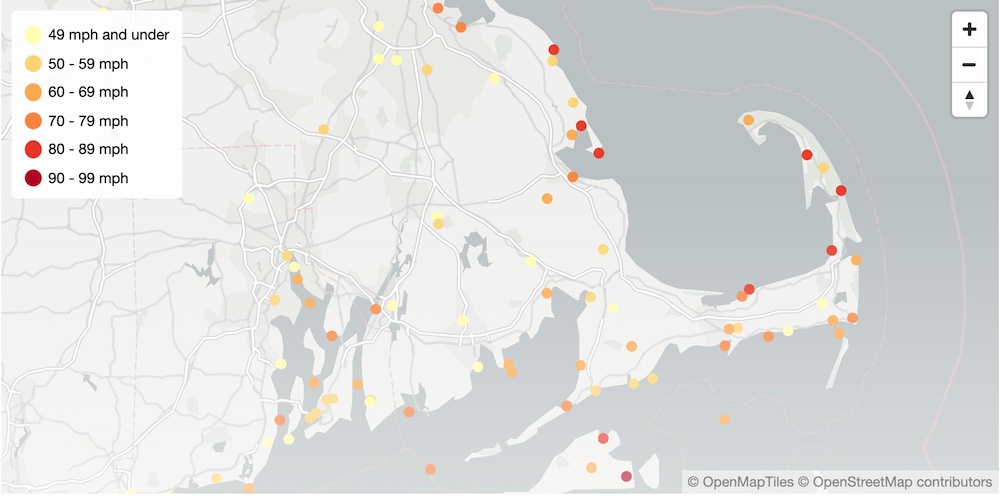
When the wind gusts line up so perfectly with the power outages it means one thing. Trees falling on power lines were the primary culprit that causes the power outages.
Why Did So Many Trees Come Down?
It’s only logical to wonder why an October nor’easter knocked down more trees than most hurricanes. It comes down to a combination of three factors that came together absolutely perfectly.
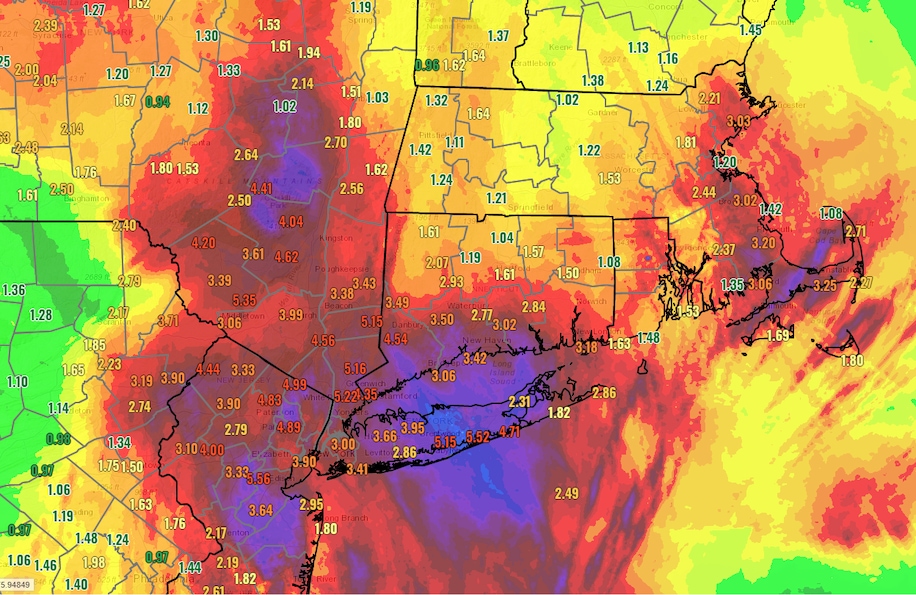
First, a huge amount of rain fell ahead of the storm. The ground was fully saturated when the peak winds hit, making it much easier to uproot trees. When it was all said and done, the Upper Cape and South Shore (Plymouth County) took the brunt of the storm, and were without power for the longest. It’s not a coincidence that the highest rainfall totals were also in that same area.
Second, the leaves were still all on the trees when the bomb cyclone hit. If you think of the trees as a lever, the leaves give the wind much more surface area to blow on. As a result, any gust of wind has much more purchase and leverage than the same gust of wind in the middle of winter. It takes much less wind to knock down trees with leaves on them than without.
Finally, power infrastructure in New England dates back to the 1800’s. Much of that infrastructure is still in place. Unlike many other places, most power in New England relies on power lines instead of running underground. Couple that with shoddy tree trimming and power lines literally running through the middle of trees, and it’s a recipe for disaster.

What a Difference Underground Wires Makes
I was living in Norman, Oklahoma when the 2013 EF-5 tornado tore through the City of Moore packing winds of 210 mph. Many older neighborhoods throughout the Oklahoma City Metro are full of large trees, much like New England. At its closest point, the Moore Tornado passed less than 4 miles from my house.
In its aftermath, the power was out for less than 2 hours, not just in Norman, but also within Moore itself. So what’s the big difference compared to New England? Most power lines in central Oklahoma are underground, and those that aren’t are built to withstand up to an EF-3 tornado.
How Can We Prevent This Level of Damage in the Future?
As the climate warms, these bomb cyclones will become more common. The best solution is to bury the power lines. It’s impossible for falling trees to take out power lines that are underground. Unfortunately, the cost of burying power lines is extraordinary. As a result, the power companies, the town, and even the state routinely balk at it.
The next best solution is to pass laws that require trees to be trimmed a certain amount back from power lines. The goal here is not to prevent trees from falling on power lines, but to minimize the risk of it. California is starting to do this after power lines have started so many fires in the Golden State. The New England states should start giving it some serious thought, too, because this will happen again.
Conclusion
The 2021 bomb cyclone was basically a 100-mile wide EF-1 tornado that lasted for 12 hours in southeastern Massachusetts. As I drove around town in the aftermath of the storm, I found it very interesting that the damage much more closely resembled tornado damage than hurricane damage. Either way, it was one hell of a storm that won’t be forgotten any time soon.
I’ve also heard plenty of comparisons of the 2021 bomb cyclone to the Perfect Storm in 1991. Both storms occurred within a few days of Halloween, packing winds of 75-80 mph and pressures as low as 980 mb. However, that’s about where the similarities end in my opinion.
The Perfect Storm started as a hurricane and got absorbed into the jet stream, much like Hurricane Sandy did in 2012. The 2021 bomb cyclone never had any tropical characteristics. Instead, it was a cold-core mid-latitude upper-level low like every other nor’easter that has ever hit New England. Only this time, everything came together just perfectly for it to morph into a monster.
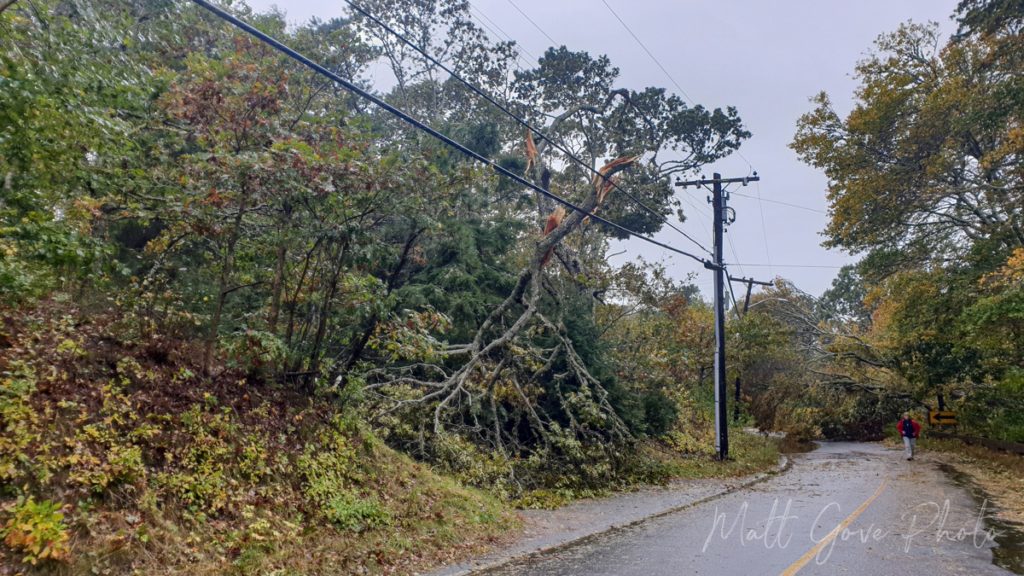
Top Photo: Downed Trees Hang From Power Lines Following the Bomb Cyclone
Falmouth, Massachusetts – October, 2021