No, that headline is not a type-o. It’s what most mathematical models are forecasting for the COVID-19 peak in the United States this winter. With 185,000 new cases yesterday alone, COVID-19 is rapidly approaching crisis levels in the United States. Hospitals and ICU’s are nearing capacity in many states as the pandemic rapidly accelerates. And this is only the beginning.
Can we make an accurate forecast of what to expect this winter? Let’s consider several COVID-19 models for the United States. Do they agree? Do they disagree? How credible are any outliers? If you’re not familiar with this method, it’s the exact same method the National Hurricane Center uses to forecast tropical cyclones and hurricanes.
Current COVID-19 Situation in the United States
Before looking at any models, it’s important to have a look at the current situation. The United States currently sits at roughly 10.7 million cumulative COVID-19 cases. It has averaged over 100,000 daily new cases for most of November so far.
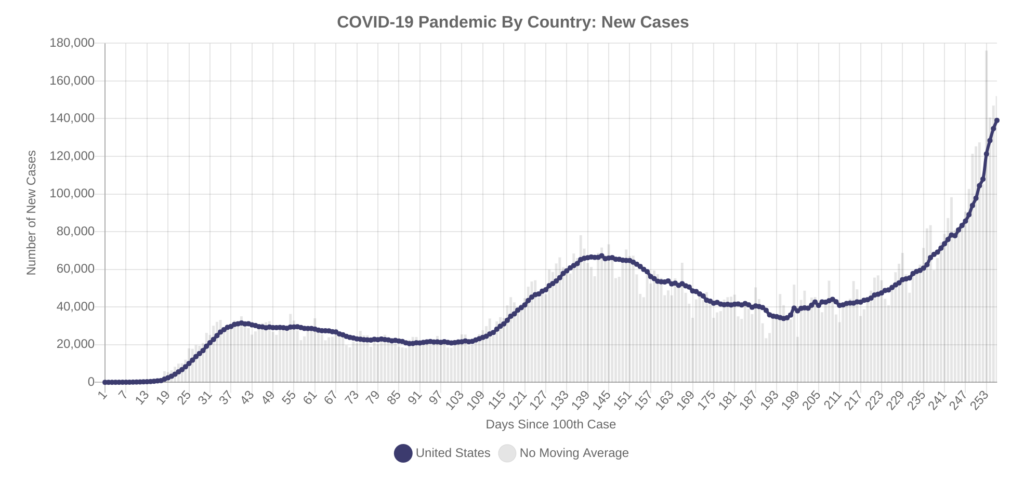
There are a few key takeaways from this chart.
- The current rate of acceleration is the highest of the pandemic so far. Notice how much steeper the current climb is compared to the left side of the previous two waves.
- Each “valley” following each wave has been higher than the previous one.
- Don’t forget that there is a lot of pandemic fatigue right now and that the United States has a high resistance to COVID-19 restrictions.
My COVID-19 Model: Case Counts in the United States
My COVID-19 model works simply by “fitting the curve” to the actual data. It’s not perfect, but it does a pretty good job. In fact, the model has been on fire recently, getting 90 to 100% of its 2-week and 1-month predictions each run correct since July.
In the plot below, the green line is the model’s prediction for what will unfold. However, there’s a caveat here. The model does not account for people gathering at Thanksgiving and Christmas. That’s where the purple and orange lines come in. They are there to show how large a spike could possibly get once you factor in the holidays. You can ignore the dates the purple and orange curves fall on.
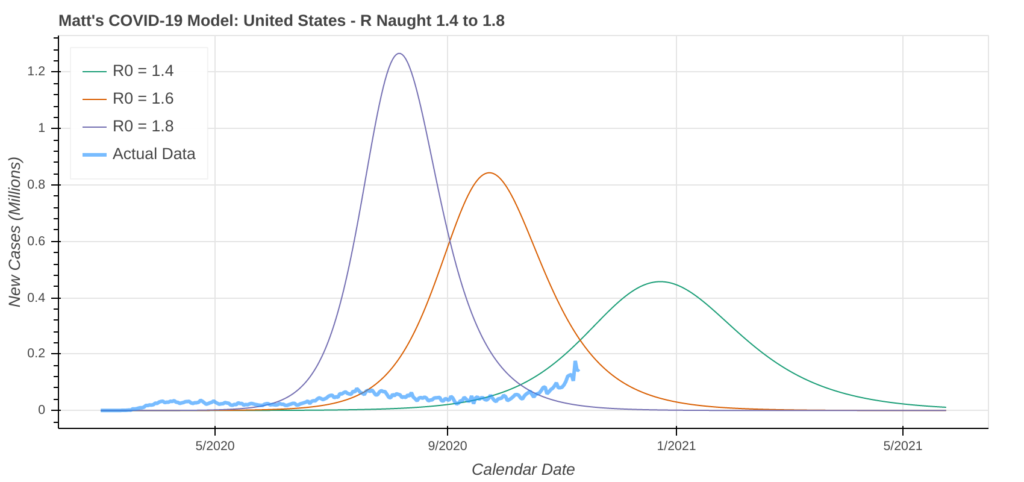
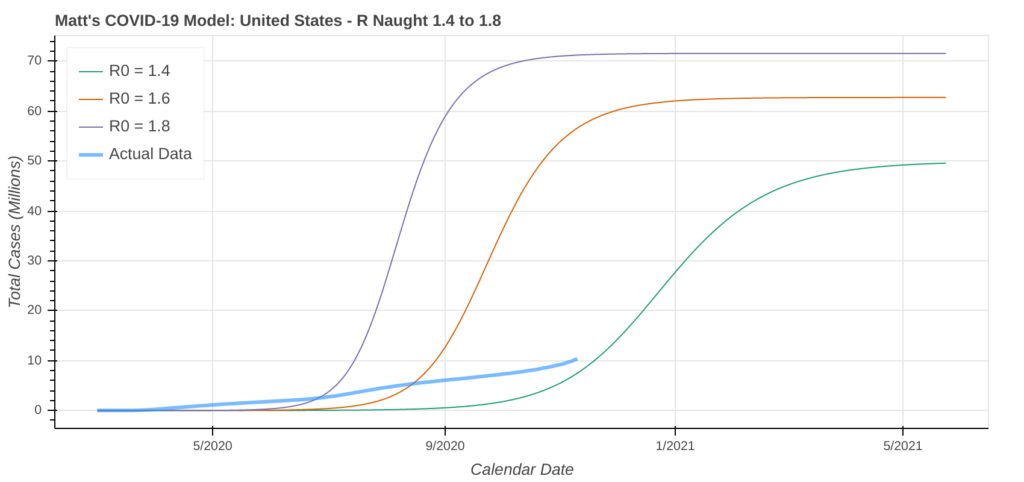
You can see in the first plot that the model expects the current wave will peak between 400,000 and 500,000 new cases per day in mid-to-late December. Keep in mind that this projection does not take the holidays into account. The holidays will likely push the peak’s date into January or February. The model did good job predicting both the spring and summer waves, so I have pretty high confidence in its winter forecast.
IHME Model Prediction for COVID-19 Deaths in the United States
Still skeptical about my model’s projections? No problem. Let’s have a look at the University of Washington’s Institute for Health Metrics and Evaluation Model. The Trump Administration has been using and citing the IHME model since the pandemic began. The IHME model will be a key source of information for the incoming Biden Administration as well.
There’s a bit of a curveball here because the IHME model focuses on deaths instead of cases, but we can calculate the approximate number of daily new cases from death projections. Here’s what the latest IHME model run forecasts for COVID-19 deaths in the United States.
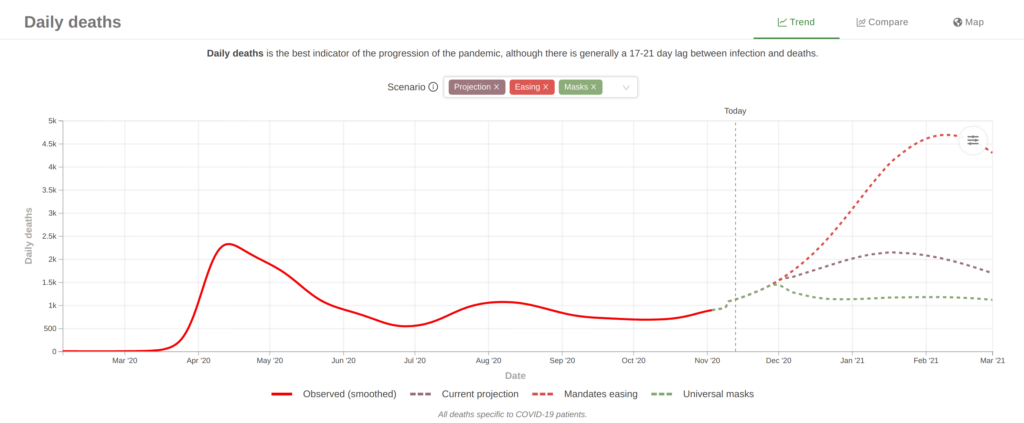
The “Current Projection” line, which is the brownish colored dashed line, is the forecast we will use for comparison. It predicts that daily COVID-19 deaths in the United States will peak at 2,140 per day in mid-to-late January.
A Back-of-the-Envelope Calculation
Now, how does this translate into new cases? We can do a simple back-of-the-envelope calculation. First, we need to calculate the current death rate. Yesterday, the United States recorded a 7-day average of about 140,000 new cases and 1,000 new deaths.
Death Rate = 1,000 / 140,000
Death Rate = 0.0071 or 0.71%
To calculate the approximate number of daily new cases at the peak, simply divide the number of daily deaths by the death rate
Daily New Cases = 2,140 / 0.0071
Daily New Cases = 301,408
I know the current IHME runs do not account for vaccines becoming available, but I’m not sure how they handle the holidays. The IHME predicts daily COVID-19 deaths in the United States will peak in mid-to-late January. New daily cases peak about one month before daily deaths, which puts the IHME in full agreement with my model’s prediction that new daily cases will peak in mid-to-late December.
For comparison, the IHME’s worst-case scenario is the red dashed line in the plot above. When you run these same calculations for the worst-case scenario, the IHME is predicting approximately 662,000 new cases per day.
COVID-19 Simulator Prediction for the United States
The COVID-19 Simulator is run by Massachusetts General Hospital, Harvard Medical School, Georgia Tech, and the Boston Medical Center. It allows you to model scenarios for different levels of COVID-19 restrictions for the United States as a whole and for each state.
I ran the simulation under the same set of assumptions as my model and the IHME model so we can make an accurate comparison. Not surprisingly, its forecasts for new daily cases are similar to both my model and the IHME model.
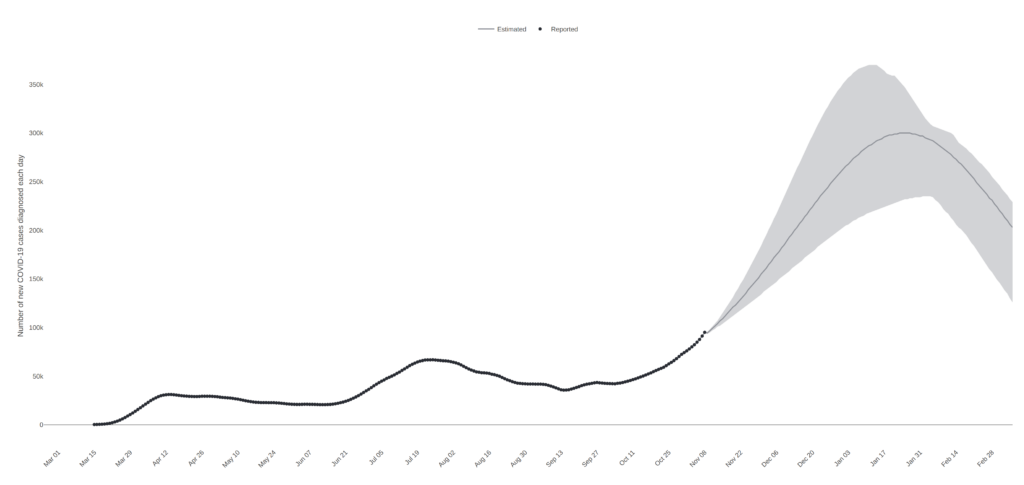
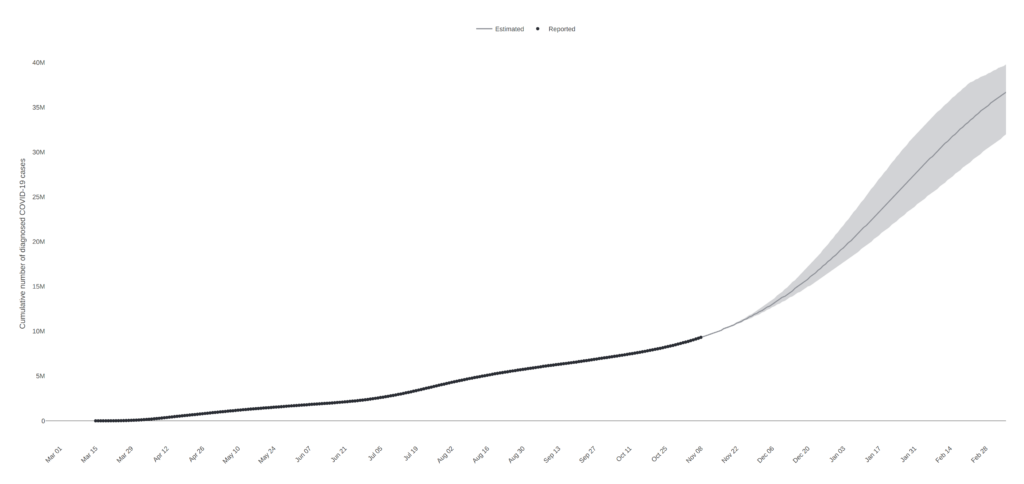
One thing that really jumps out about this plot. The actual data curve is currently outpacing the model’s worst-case scenario. Will it stay that way? We’ll have to wait and see. If it does, you are going to see eye-popping numbers. The worst-case scenario peaks at 370,000 new daily cases in early January.
A Forecast for COVID-19 in the United States Based on These Models
Weather forecasters use the output from several models to make their official forecasts. Let’s do the same thing for COVID-19 in the United States. Before we do that, let’s look at the results from each model run.
| Model | Peak New Daily Cases | Peak Date |
|---|---|---|
| Matt’s Model | 400,000 to 500,000 | Mid-to-late December |
| IHME | 300,000 to 400,000 | Mid-to-late December |
| COVID-19 Simulator | 240,000 to 370,000 | Early-to-mid January |
You can see that the three models are in pretty good agreement. As a result, we can make a forecast with a high degree of confidence. We’ll give a heavier weight to the IHME and the COVID-19 Simulator because they are, you know, actually made by infectious disease experts. After putting everything together, we can make the following forecast.
- The peak of the winter wave will occur around New Year’s Day (1 January, 2021)
- There will be 320,000 to 400,000 new daily COVID-19 cases in the United States at the peak of the winter wave.
- By next spring, there will be 30 to 50 million total confirmed COVID-19 cases in the United States.
Conclusion
Back in May, several highly respected infectious disease experts warned that this winter would be one of the darkest winters the United States has ever seen. Based on these model projections, it sure looks like they were right. Despite the impending doom, it’s still not too late to take action to prevent the spread of COVID-19.
The big wildcard for how bad the winter wave will be is how people behave over the holidays. Unfortunately, the holidays will likely accelerate the outbreak even more. People are burnt out with pandemic fatigue and want to see their loved ones. I do too, trust me.
Perhaps the most chilling warning, however, comes from up north. Canada celebrated its Thanksgiving on 12 October, which is Columbus Day in the United States. As you can probably guess, COVID-19 cases in Canada have skyrocketed since then.
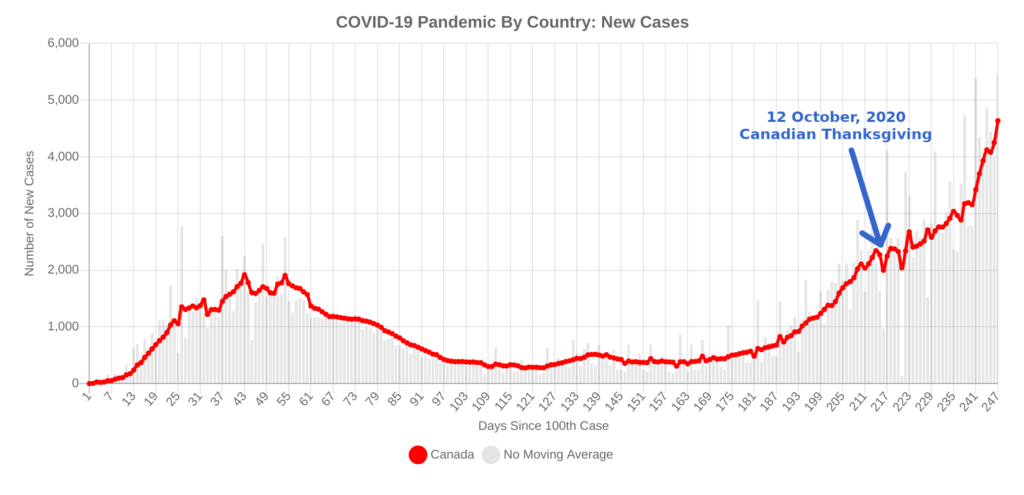
Please be smart this holiday season and take the necessary precautions to prevent the spread of COVID-19. I want nothing more than to be able to look back in the spring and say that these forecasts were way overblown. Mask up, keep gatherings small, and don’t travel unless you absolutely have to.
It’s not too late to start taking extra COVID-19 precautions. There’s still time to avoid going back into lockdown, but it’s quickly running out. Without action, we may be staring down a humanitarian disaster on a level the United States has not seen in a very long time.
Top Photo: View of the San Francisco Peaks from the Kaibab National Forest
Near Williams, Arizona – July, 2016