A little over a month ago, we examined the benefits of using region mapping in your TerriaJS applications. Region mapping allows you to reduce your GIS application’s data usage by over 99%, permitting you to display massive datasets on two and three-dimensional maps that load quickly and are highly responsive.
Despite the power and benefits region mapping offers, setting it up can be tedious, time consuming, and rife with type-o’s if you attempt to do it manually. This can be particularly frustrating if you have a large number of regions you want to map. Thankfully, there’s a much easier way. With just 49 lines of Python code, you can generate region maps of any size in just seconds, freeing up valuable time for you to focus on more important tasks.
What You’ll Need
You’ll need a few items to get started with your TerriaJS region mapping automation.
- The ESRI Shapefile or GeoJSON file that you used to generate your Mapbox Vector Tiles (MVTs) for the region mapping
- The Python script you’ll write in this tutorial
- A Terminal or Command Prompt
What is a Region Mapping File
In TerriaJS, a region map consists of two JSON files.
- The actual region map
- The region mapping configuration file
The Python script we’re writing in this tutorial generates the actual region map. The region map tells TerriaJS the order that each polygon appears in the vector tiles. The configuration file instructs TerriaJS which vector tile parameters contain the region’s unique identifier, name, and more. You can easily write a short Python script to generate the configuration. However, unless you have a lot of region maps you’re generating, I find that the configuration is so short, it’s easier to do manually.
Convert all Shapefiles to GeoJSON Before Automating Region Mapping
If you have ESRI Shapefiles, convert them to GeoJSON before automating your region mapping. We do this for two reasons.
- Python can read and parse GeoJSON files natively. To parse shapefiles, you’ll need a third-party library such as GeoPandas.
- Mapbox’s Tippecanoe program, which generates the Mapbox Vector Tiles we use for region mapping, requires files to be input in GeoJSON format.
The GeoJSON should contain at least three properties for each feature. We covered these properties in detail in our previous article about region mapping, so I won’t repeat them here. You’re welcome to add as many properties as you want, but it should at the bare minimum contain the following three features.
- A Feature ID, or FID.
- A unique identifier you’ll use to identify the feature in the CSV data files you load into Terria.
- The name of the feature
Most of our map tiles actually contain several unique identifiers that can be used. For example, countries actually have two sets of ISO (International Organization for Standardization) standards, plus a United Nations code that can be used to uniquely identify them. We can use any of these three, plus our own unique identifier to map them to our Mapbox Vector Tiles.
| Country | ISO Alpha 2 Code | ISO Alpha 3 Code | UN Numeric Code |
|---|---|---|---|
| Australia | AU | AUS | 036 |
| Brazil | BR | BRA | 076 |
| Canada | CA | CAN | 124 |
| France | FR | FRA | 250 |
| Mexico | MX | MEX | 484 |
| New Zealand | NZ | NZL | 554 |
| United States | US | USA | 840 |
All right, let’s dive into the Python code.
First, Input Python’s Built-In json Library
The real magic of region mapping in TerriaJS is that all of the files are just JSON files, which are compatible with every popular programming language today. As a result, all we need to do the automation is Python’s json library. The json library comes standard with every installation of Python. We just need to import it. We will also be using Python’s os library to ensure the correct paths exist to output our region mapping files.
import json
import os
First, Write a Python Function to Extract the Feature ID from each Feature in the GeoJSON
This is because you need to go down several layers into the GeoJSON and we need this functionality a lot. It’s best practice to avoid string literals in programming, so we’ll use a function to extract the Feature ID from any given feature in the GeoJSON file.
def fid(f):
    return f["properties"]["FID"]
Define Your Input Parameters
We define the GeoJSON file name, the layer name in the TerriaJS region mapping configuration (regionMapping.json), and the property we’ll use as the unique identifier in our region mapping. Even if your MVT tiles have multiple unique identifier, you may only choose one for each region map. You’ll need to generate a second region map if you want to use multiple unique identifiers.
GEOJSON = "world-countries.geojson"
LAYER = "WORLD_COUNTRIES"
MAPPING_ID_PROPERTY = "alpha3code"
OUTPUT_FOLDER = "regionIds"
If you prefer not to have to manually edit the Python script every time you want to change files, you can easily update the Python script to extract this information from the filename or receive it through command line arguments.
Define the Output Path for Your Region Map File
I like to do this right away because it uses the input parameters. This both gets it out of the way so we don’t need to deal with it later and eliminates the need to scroll up and down looking for variable names if we were to define these at the end. We’ll structure our output paths so they can just be copied and pasted into Terria when we’re done. No renaming or reshuffling of files required.
geojson_filename = GEOJSON.replace(".geojson", "")
output_json_filename = "region_map-{}.json".format(geojson_filename)
output_fpath = "{}/{}".format(OUTPUT_FOLDER, output_json_filename)
In this example, the output filepath or our region mapping file will be regionIds/region_map-world-countries.json.
Read the GeoJSON into Python
Because GeoJSONs are just a specific type of JSON file, we can use Python’s built in json module to read and parse the GeoJSON file.
with open(GEOJSON, "r") as infile:
    raw_json = json.load(infile)
Sort the GeoJSON features by Feature ID
When you convert the GeoJSON to MVT tiles, Tippecanoe sorts the GeoJSON by Feature ID. For the region mapping to work correctly, the feature in the region map must appear in the exact same order as they appear in the Mapbox Vector Tiles. If they’re not in the exact same order, your data will be mapped to the wrong features in TerriaJS. What’s particularly insidious about this issue, is that it will appear as if your data is mapped to the correct county, even though it’s not.
When I first tried to set up region mapping for the World Countries vector tiles, I did not have the features in the right order. Data for the United States was mapped to Ukraine and labeled as Ukraine’s data. France’s data showed up in Fiji, and New Zealand’s data appeared to be Nepal’s. And that’s just to name a few. Except for a few countries at the top of the alphabet that start with “A”, this issue plagued every country. Once I sorted the GeoJSON features by Feature ID, the problem magically went away.
raw_features = raw_json["features"]
features = sorted(raw_features, key=fid)
Note here that we use the fid function we defined above to identify the Feature ID in the sorted() function.
TerriaJS Region Maps are just Arrays of Sorted Feature ID’s
To generate the region map for TerriaJS, all we need to do is just loop through the sorted features and create an array of the unique ID for each feature. Remember that the unique ID is different from the Feature ID. For world countries, TerriaJS comes with the Alpha 2 Codes built into it. For this tutorial, we’ll use the ISO Alpha 3 code as our unique identifier, which we defined in the MAPPING_ID_PROPERTY variable in the use input. If you’ve forgotten, the alpha 3 code is just a 3-letter code that identifies each country. For example, use “USA” for the United States, “CAN” for Canada, “JPN” for Japan, and so forth.
We’ll generate the region map with a simple for loop.
region_mapping_ids = []

for f in features:
    properties = f["properties"]
    region_map_id = properties[MAPPING_ID_PROPERTY]
    region_mapping_ids.append(region_map_id)
Assemble the full TerriaJS Region Mapping JSON in a Python Dictionary
TerrisJS region mapping files are breathtakingly simple. They require three parameters.
layer: The name of the layer in the TerriaJS Region Mapping configuration (regionMapping.json). We defined it above with theLAYERvariable in the user input.property: The name of the unique identifier in your vector tiles that you’ll use in the CSV files you load into Terria. For the world countries, we’re using thealpha2codeidentifier. We defined this in the user input using theMAPPING_ID_PROPERTYvariable.values: This is the the array of sorted feature ID’s we created in the previous section
It’s important to note that Python does not actually support JSON format. Instead, when you read a JSON file into Python, it actually converts the JSON into a Python dictionary. When we export the dictionary to JSON format, Python just simply does the conversion in the opposite direction.
Anyway, the TerriaJS region mapping JSON should look like this as a Python dictionary.
output_json = {
    "layer": LAYER,
    "property": MAPPING_ID_PROPERTY,
    "values": region_mapping_ids,
}
Also, don’t forget to create the output directory if it doesn’t exist. Your Python script will crash without it.
if not os.path.isdir(OUTPUT_FOLDER):
    os.makedirs(OUTPUT_FOLDER)
Finally, Write the TerriaJS Region Mapping JSON to a .json File
Thanks to Python’s json module, we can output the region mapping file with just a couple lines of code.
with open(output_fpath, "w") as ofile:
    json.dump(output_json, ofile, indent=4)
If you did everything correctly, the region mapping JSON you just created should look like this.
{
    "layer": "WORLD_COUNTRIES",
    "property": "alpha3code",
    "values": [
        "AFG",
        "ALB",
        "DZA",
        "AND",
        "AGO",
        "ATG",
        ...
    ]
}
But we’re not quite done, yet!
Add Your New TerriaJS Region Mapping to the Configuration File
The final step is to add your new region map to the TerriaJS Region Mapping configuration file. By default, the configuration file is located at data/regionMapping.json. However, if you can’t find it, it’s defined in the config.json file at the root of the Terria application. You are more than welcome to automate this, too, but I find that it’s so simple, it’s often easier to just do manually.
The configuration file instructs TerriaJS how to interpret each region map. You’ll need to include several parameters.
| Parameter | Description |
|---|---|
layerName | The name of the layer in the Mapbox Vector Tiles. If you can’t remember it, check your vector tiles’ metadata. |
server | The URL from where your Mapbox Vector Tiles are served |
serverType | The type of files the server is serving. For this tutorial, use MVT, which stands for “Mapbox Vector Tiles”. |
serverMinZoom | The minimum zoom level of the vector tiles |
serverMaxNativeZoom | The maximum zoom level the vector tiles support natively |
serverMaxZoom | The maximum zoom level the vector tiles support |
regionIdsFile | The path to the TerriaJS Region Mapping JSON we created in this tutorial |
regionProp | The name of the property in the vector tiles that contains the unique identifier we’re using in the region map. |
aliases | Any column headers in the CSV data file that TerriaJS should interpret as the unique identifier of your region map |
description | A description of the region map |
bbox | The bounding box of your vector tiles, in the format [west, south, east, north] |
nameProp | The name of the property in the vector tiles that contains the name of each feature |
Using the layer we defined in the LAYER variable as the JSON key, your regionMapping.json configuration file should look like the following.
{
    "regionWmsMap": {
        ...
        "WORLD_COUNTRIES": {
            "layerName": "world-countries",
            "server": "https://yourvectortileserver.com/worldcountries/{z}/{x}/{y}.pbf,
            "serverType": "MVT",
            "serverMinZoom": 0,
            "serverMaxNativeZoom": 3,
            "serverMaxZoom": 8,
            "regionIdsFile": "data/regionIds/region_map-world-countries.json",
            "regionProp": "alpha3code",
            "aliases": ["alpha3code", "country_id", "COUNTRY_ID"],
            "description": "World Countries",
            "bbox": [
                -179.99999999999999999999999,
                -85,
                179.999999999999999999999999,
                85
            ],
            "nameProp": "name"
        },
        ...
    }
}
Create a Dummy CSV File to Test it Out
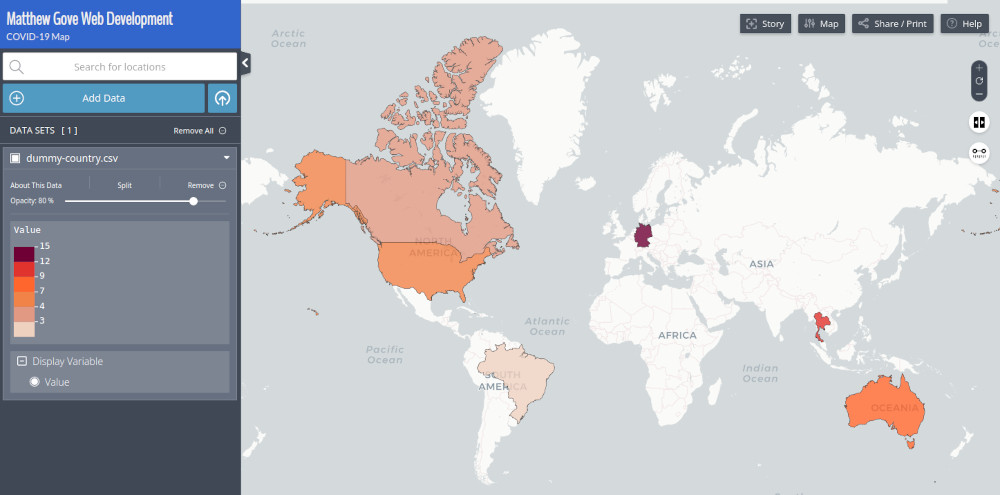
The funnest part of any project is seeing it all come to life once you’re done. To do this, create a dummy CSV file to test that your region mapping actually works. Pick a bunch of countries at random, assign them some random values as a dummy parameter, and see if they show up on the map.
| alpha3code | Value |
|---|---|
| USA | 7 |
| CAN | 4 |
| DEU | 15 |
| THA | 12 |
| AUS | 9 |
| BRA | 3 |
To load the file into TerriaJS, just click on the upload button at the top of the workbench, next to the “Browse Data” or “Explore Map Data” button. If the region mapping is working properly, you should see your data appear appear on the map.
Conclusion
Region mapping is one of the most powerful and efficient ways to display enormous amounts of data in TerriaJS. Automating the region mapping process only saves you valuable time and makes your application even more powerful.
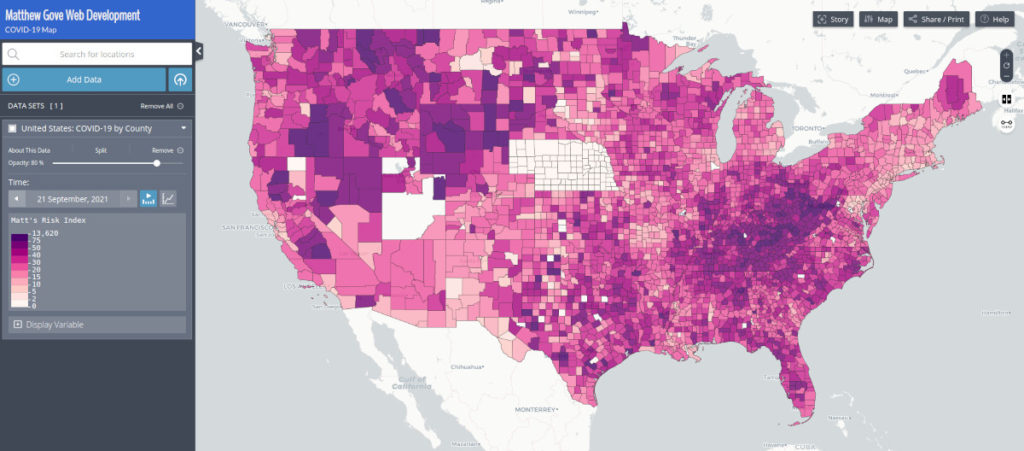
While manually region mapping feature sets such as the 50 US states or the roughly 200 world countries may initially seem manageable, it rapidly becomes a nightmare once you try to scale it up. Sticking just within the United States, what if instead of the 50 states, you were mapping America’s more than 3,000 counties? Our COVID-19 Dashboard map does just that. Or even worse, the United States has over 41,000 postal codes and more than 73,000 census tracts. Can you imagine having to assemble those region maps manually, or the opportunity for type-o’s manually entering tens of thousands of data points?
Instead, save yourself the time, money, and hassle. We’ve made the Python script available for free on Bitbucket so you can configure region maps of any size in TerriaJS in just seconds. And if you ever run into issues, we’re always here to help you with any questions you may have. Happy mapping!
Top Photo: Snow-Capped Sierra Nevada Provide a Spectacular Backdrop for Lake Tahoe’s Brilliant Turquoise Waters
Meeks Bay, California – February, 2020
Pingback:How to Boost Your GIS Productivity with Python Automation in 5 Minutes