Well, we’ve got another classic and textbook bomb cyclone that got its crosshairs firmly trained on southern New England. It’s expected to arrive sometime late Friday or early Saturday. The low will soon form off the coast of the Carolina. As it heads north, it will undergo bombogenesis as it tears towards southern New England. Today, we’re going to a detailed model analysis to identify the biggest threats from this storm, as well as the locations that will feel the greatest impact.
We’re going to look at the same four models as we did for Hurricanes Henri and Ida last summer. However, I just launched a complete redesign of this blog less than a week ago. That redesign will allow us to analyze the models in a way that’s much easier to compare, and hopefully much easier to understand. Let’s get started.
Big Picture Overview
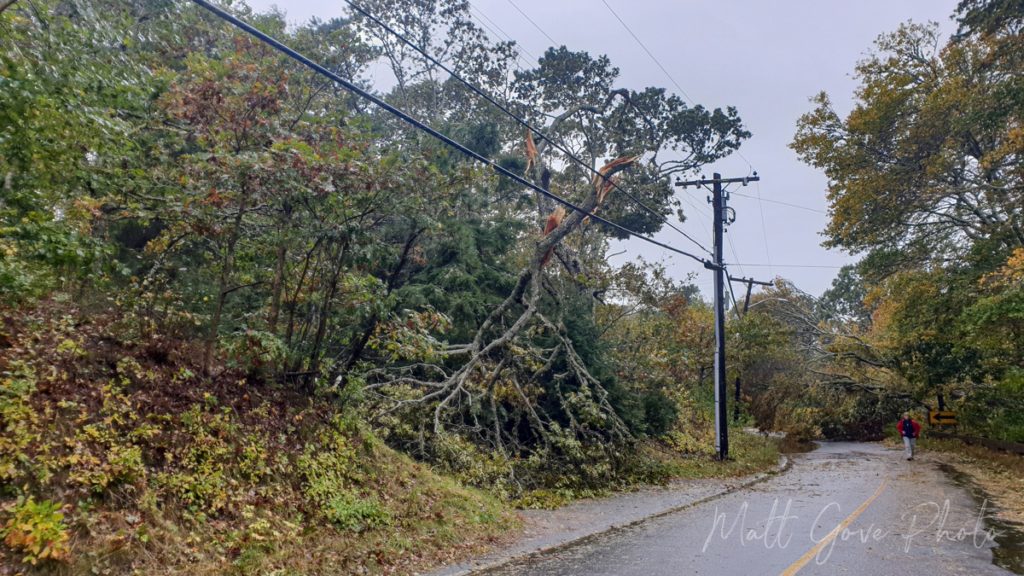
When I look at the “big picture” meteorological setup, I immediately see just how similar this setup is to the October, 2021 nor’easter. That storm slammed into southern New England on 26 October, packing wind gusts over 100 mph (160 km/h) and heavy rains. Trees and power lines were down all over the place, knocking out power for several days. At one point all of Massachusetts south and east of the I-95 corridor was 100% without power.
Likewise, the current storm is a rapidly strengthening, or “bombing” cyclone. To be classified as a bomb cyclone, a storm must undergo a 24 millibar pressure drop in 24 hours. Will that happen with this storm? It remains to be seen, but it’s quite likely.
On the upper air map, you’ll see a large, powerful trough digging south over the Carolinas. That trough will rapidly strengthen, undergoing bombogenesis as it pull north. Look at all the energy, shown in the orange and red colors, off the coast of Georgia and Florida.

What Causes Bombogenesis?
There’s one major feature on the above map that jumps out at me. See the corridor of strong winds that stretches from northern Mexico to the southern tip of Florida? That’s the subtropical jet, which serves two purposes here.
- Funnels a nearly endless stream of rich tropical moisture from the Gulf of Mexico into the developing bomb cyclone.
- Exerts a west-to-east force on the southern edge of the nor’easter, which accelerates the spin of the upper-level low.
Both influences will have significant impacts on rain and snowfall totals, as well as wind speeds. We’ll dive into those details shortly. Furthermore, even without the subtropical jet, the storm will track pretty much right over the Gulf Stream. The Gulf Stream alone provides more than enough fuel for the storm to rapidly strengthen and maintain itself.
Similarities to the October, 2021 Bomb Cyclone
So just how similar are the meteorological setups between this storm and the October nor’easter?
- Both storms are bomb cyclones
- They both formed off the coast of Georgia and the Carolinas
- There is an immense amount of tropical moisture to tap into from the Gulf Stream
- Steering currents are nearly identical
This Bomb Cyclone will not Impact New England like the October Storm Did
The greatest impact of the October storm was the widespread power outages. As a New England native, I’ve been through some monster storms over the years. I’ve never seen power outages and downed trees anywhere close to the magnitude we saw following the October nor’easter.
Thankfully, it’s extremely unlikely you’ll see anything remotely close to the magnitude of power outages in October. The biggest difference is that the leaves are no longer on the trees. As a result, the surface area of the trees is far less, meaning that it takes much greater winds to do the same amount of damage. Additionally, the most vulnerable limbs, branches, and trees came down in the October storm. This time around, trees and limbs won’t come down nearly as easily. Don’t get complacent, though. The risk of power outages is definitely there with this storm.
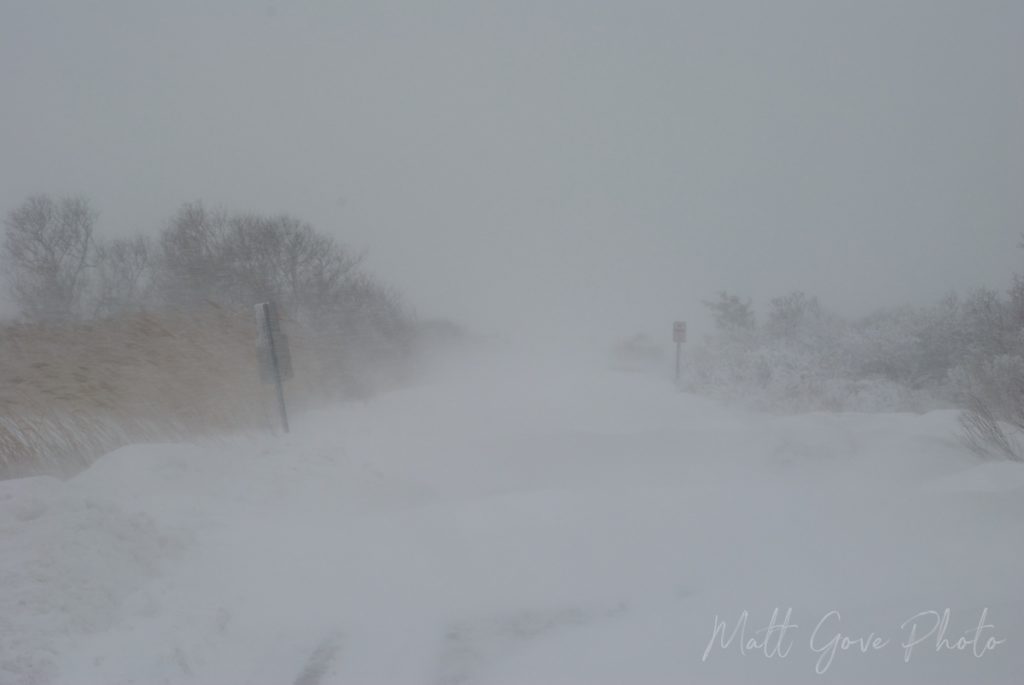
However, where you may dodge one bullet, there are others you’ll have to content with. The shift from fall into winter brings in much colder air. The precipitation in the October storm all fell as rain. This time around, you’ll be dealing with snow. And lots of it.
A Better Storm For Comparison
In fact, for a much similar storm, forget the October nor’easter. Instead, go back to exactly 7 years ago today – 27 January, 2015. That day, the first Blizzard of 2015 dumped over 3 feet of snow across southern New England. It kicked off an infamous snowmageddon winter, that plunged the region into a months-long deep freeze.
All right, enough history. Let’s dive into the models.
Model Comparison: Bomb Cyclone Track and Timing
Let’s look at the same models we did with our analysis of Hurricanes Henri and Ida last summer. If you’ve forgotten those models, here they are.
| Model | Abbreviation | Country |
|---|---|---|
| Global Forecast System | GFS | United States |
| European Centre for Medium-Range Weather Forecasts | ECMWF | European Union |
| Global Deterministic Prediction System | GDPS | Canada |
| United Kingdom Meteorological Office Model | UKMET | Great Britain |
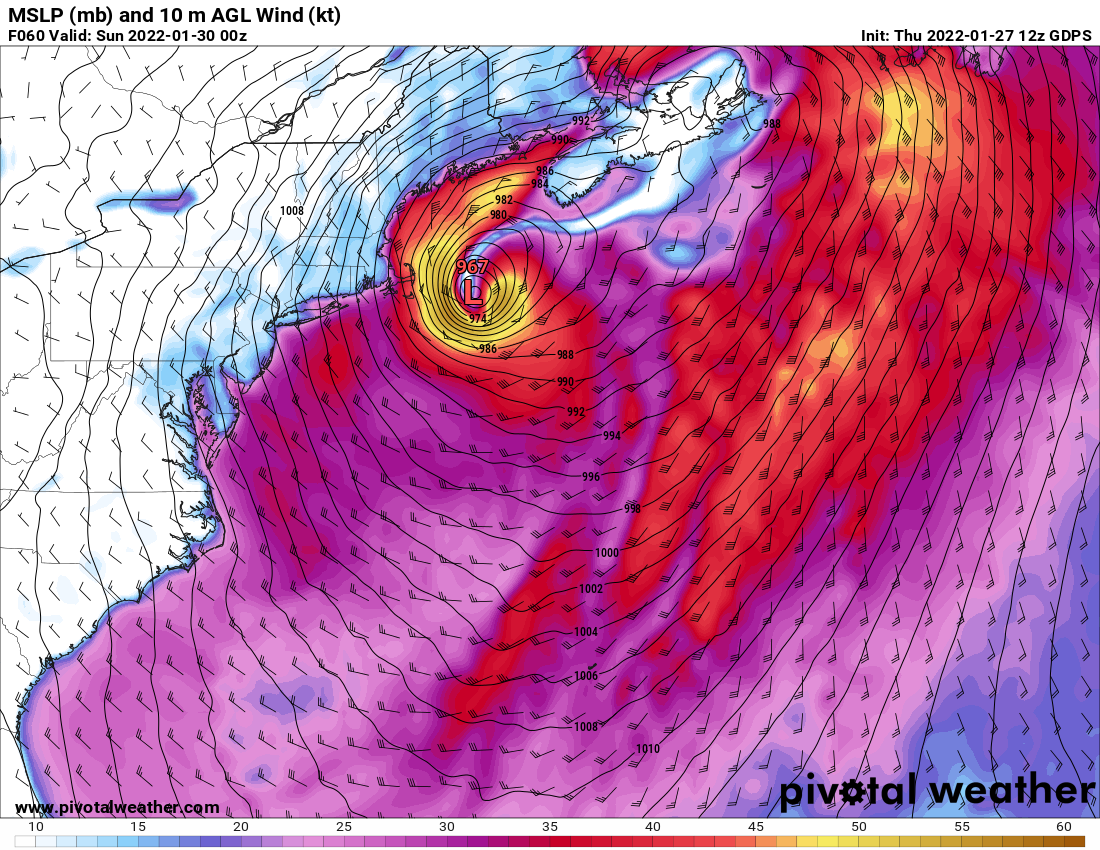
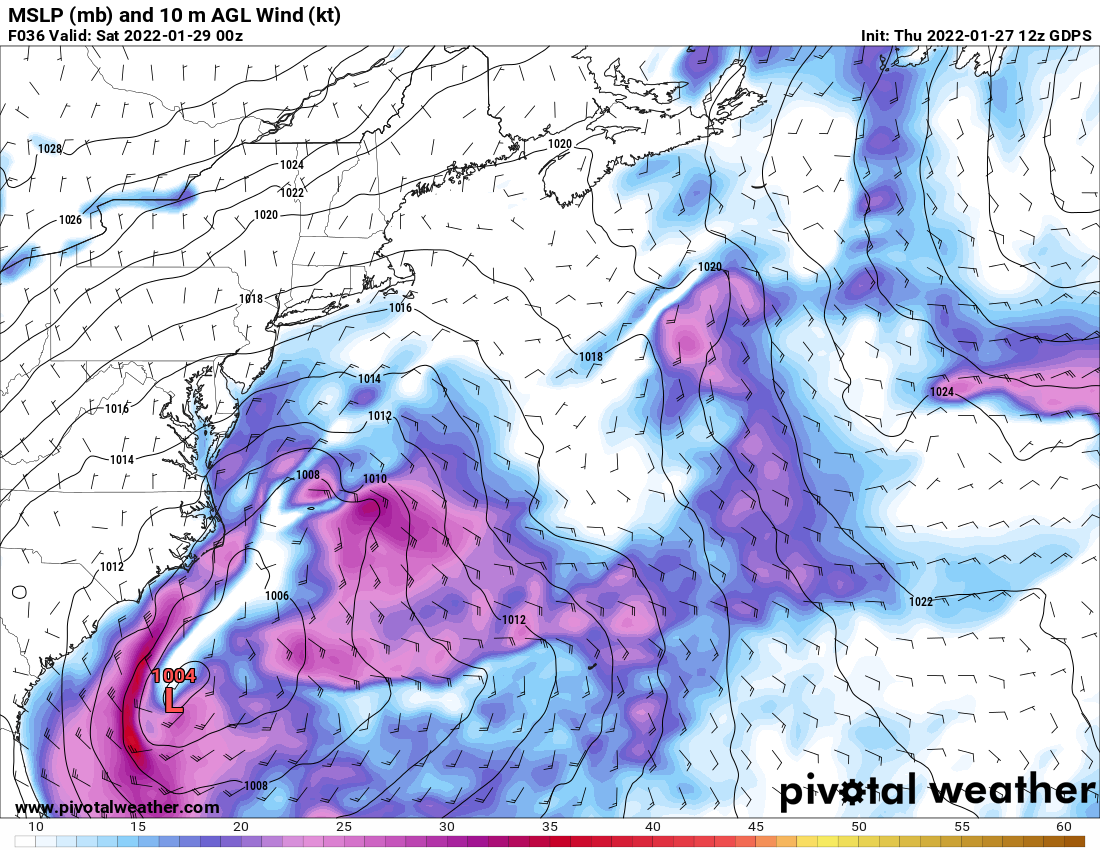
For tracking and timing, you want to focus on the position of the center of the surface low, denoted by the red “L” on the map. In addition, note the timestamp on the upper left corner of the map. Those timestamps are in Zulu time, or UTC. Eastern time is 5 hours behind UTC. Don’t worry about the wind barbs for now. We’ll look at those in much more detail shortly. Click on any image to view it in full size.

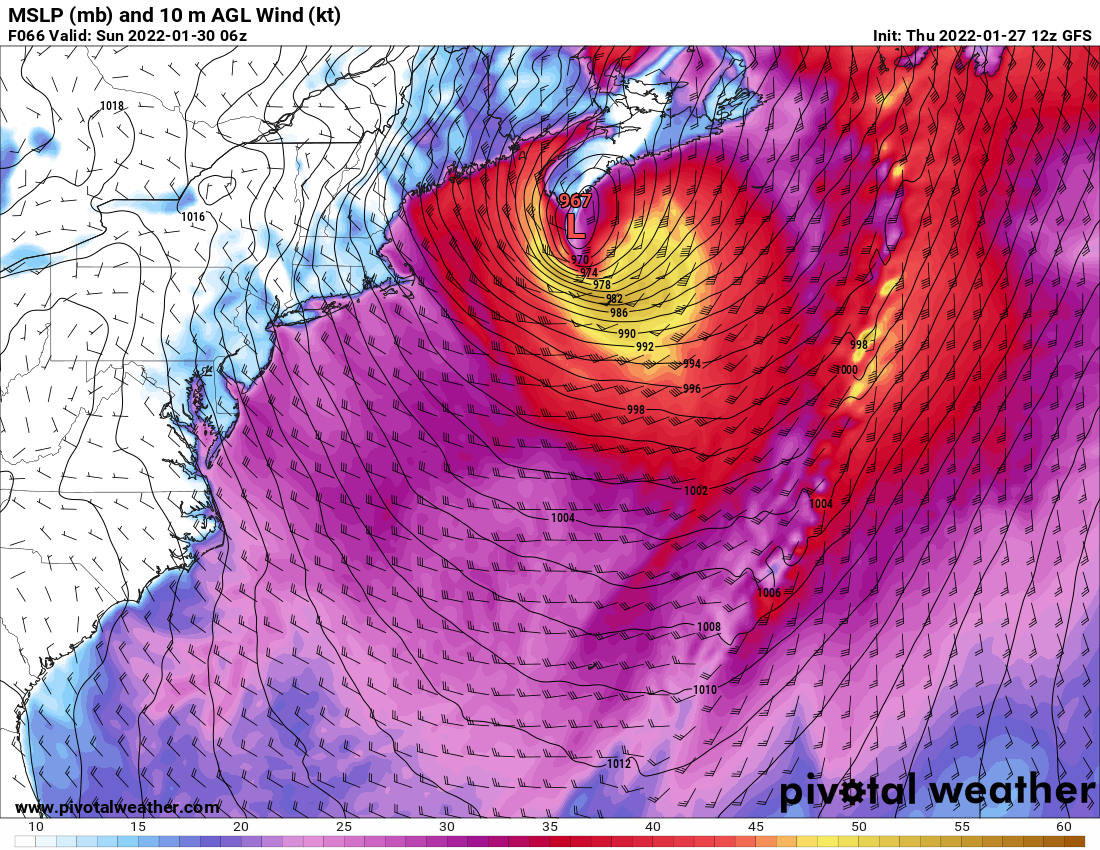
GFS (American) 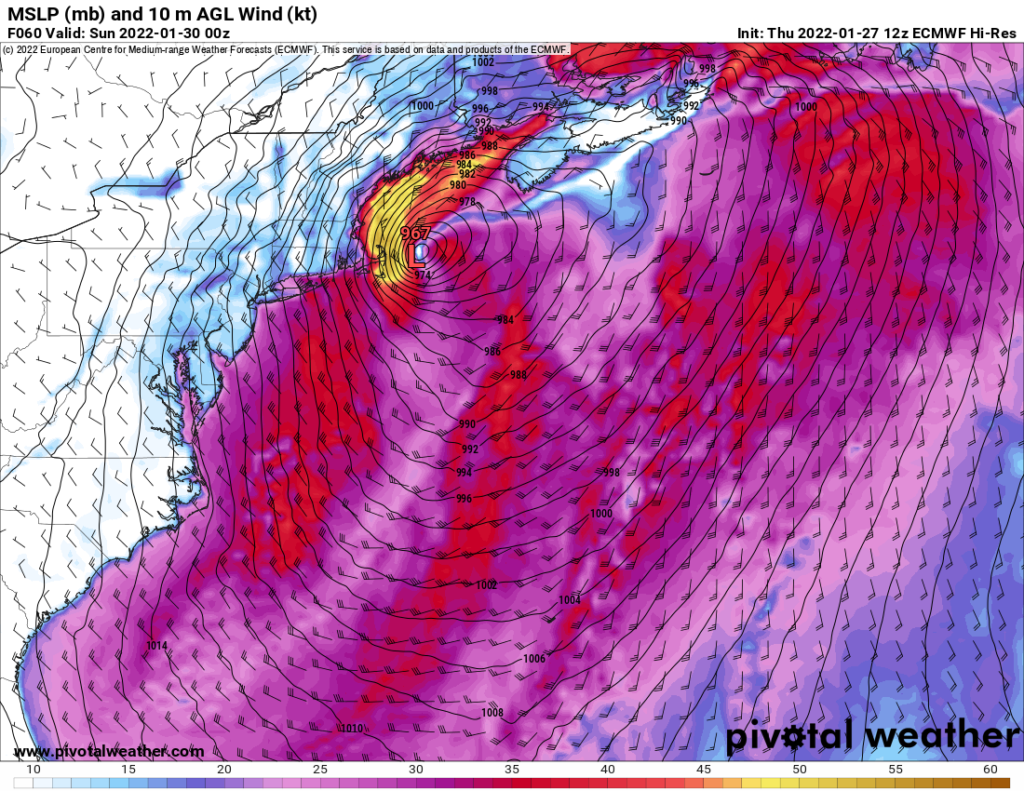
ECMWF (European) 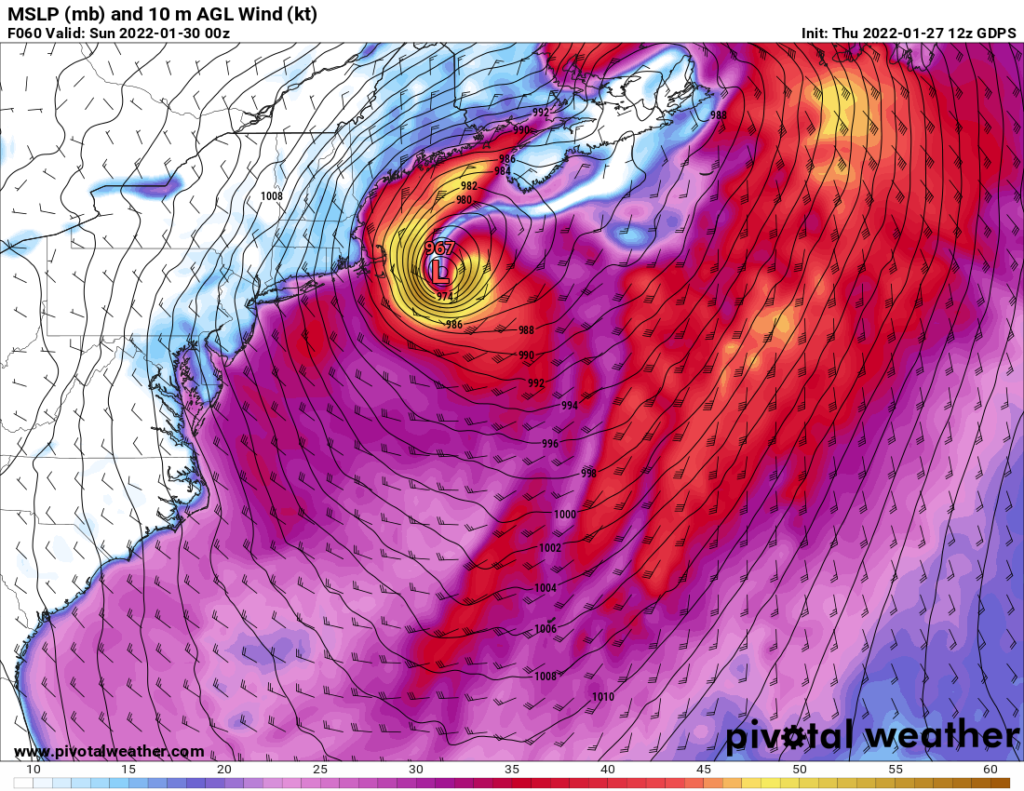
GDPS (Canadian) 
UKMET (British)
As you can see, the American, European, and Canadian models are in very close agreement with each other. They show the the low passing just offshore of Cape Cod and the Islands around 00Z on Sunday (7 PM EST Saturday). The UKMET shouldn’t be discounted, either. It’s timing agrees with the other three models. Steering currents over the Appalachians can easily push the storm further offshore. However, it’s unlikely that it will pass any closer to the coast than what the GFS, ECMWF, or GDPS indicate.
Model Comparison: Bomb Cyclone Intensity (Pressure)
All right, it’s time to answer the million dollar question: will this storm bomb? To do this, we’ll need to figure out when each model expects the storm to reach its peak intensity, or minimum pressure. Then, we’ll compare the pressure at its peak intensity to the pressure 24 hours earlier. Remember, in order for a storm to be considered a bomb cyclone, it must undergo a 24 millibar pressure drop in 24 hours. Here is when each model expects the storm to reach its peak intensity.
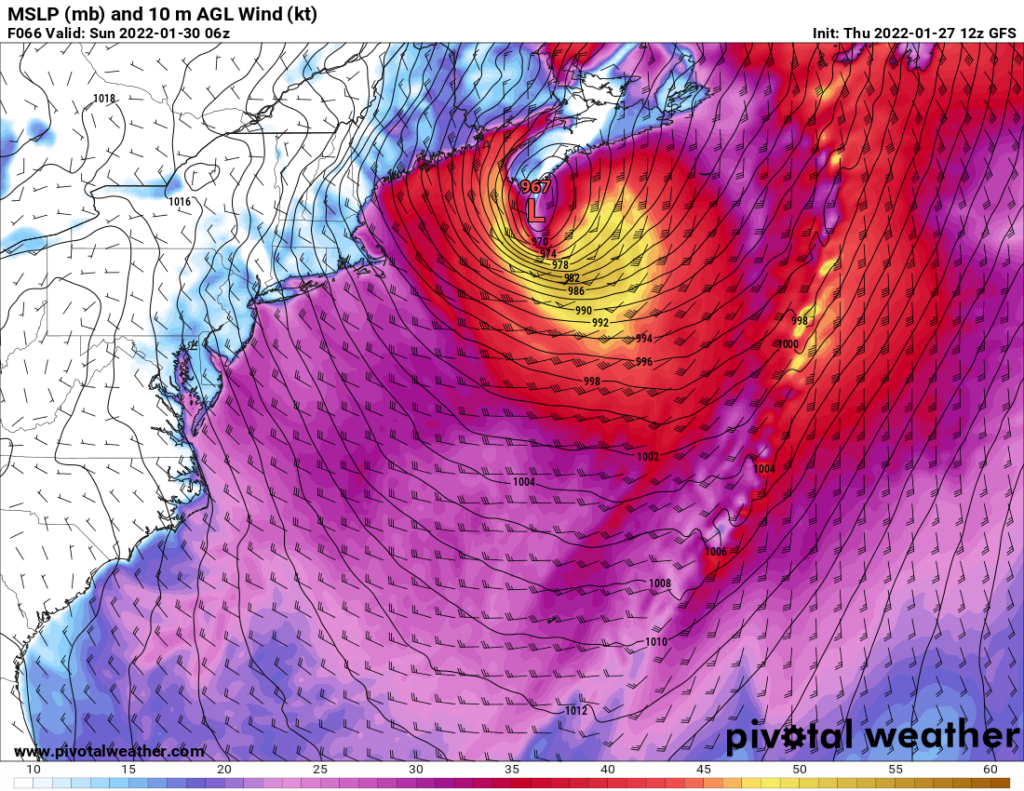
GFS: 967 mb Sunday at 1 AM EST 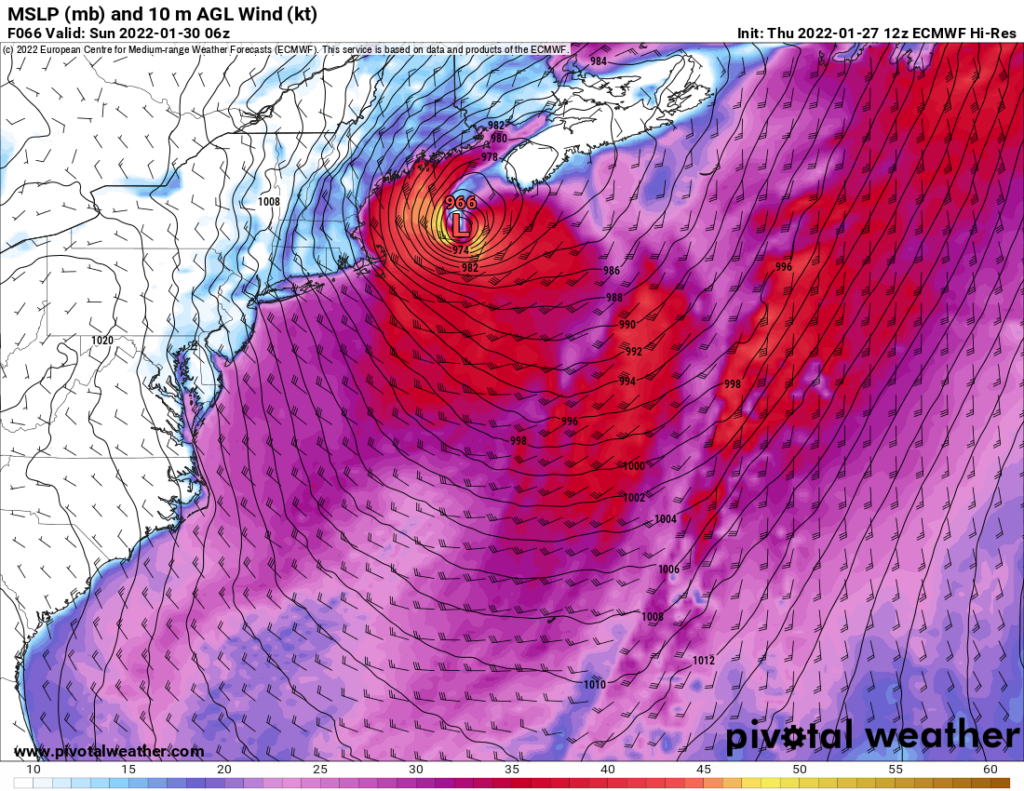
ECMWF: 966 mb Sunday at 1 AM EST GDPS: 967 mb Saturday at 7 PM EST 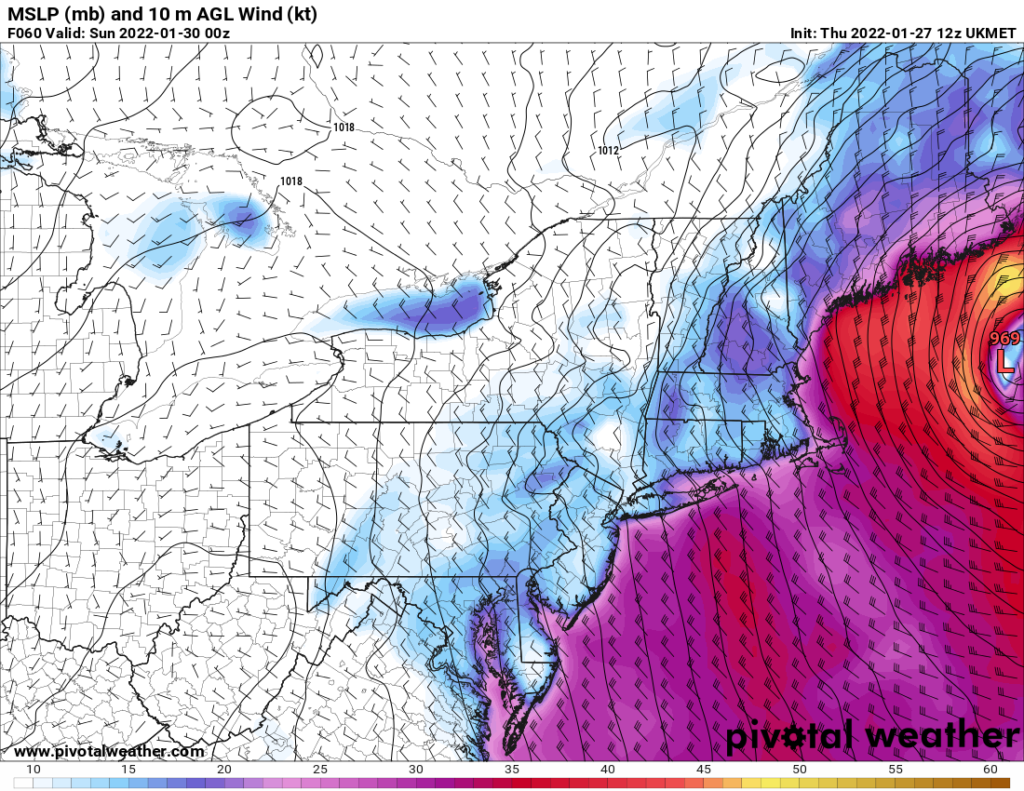
UKMET: 969 mb Saturday at 7 PM EST


Now, all we need to do is compare it to the same plots 24 hours earlier.
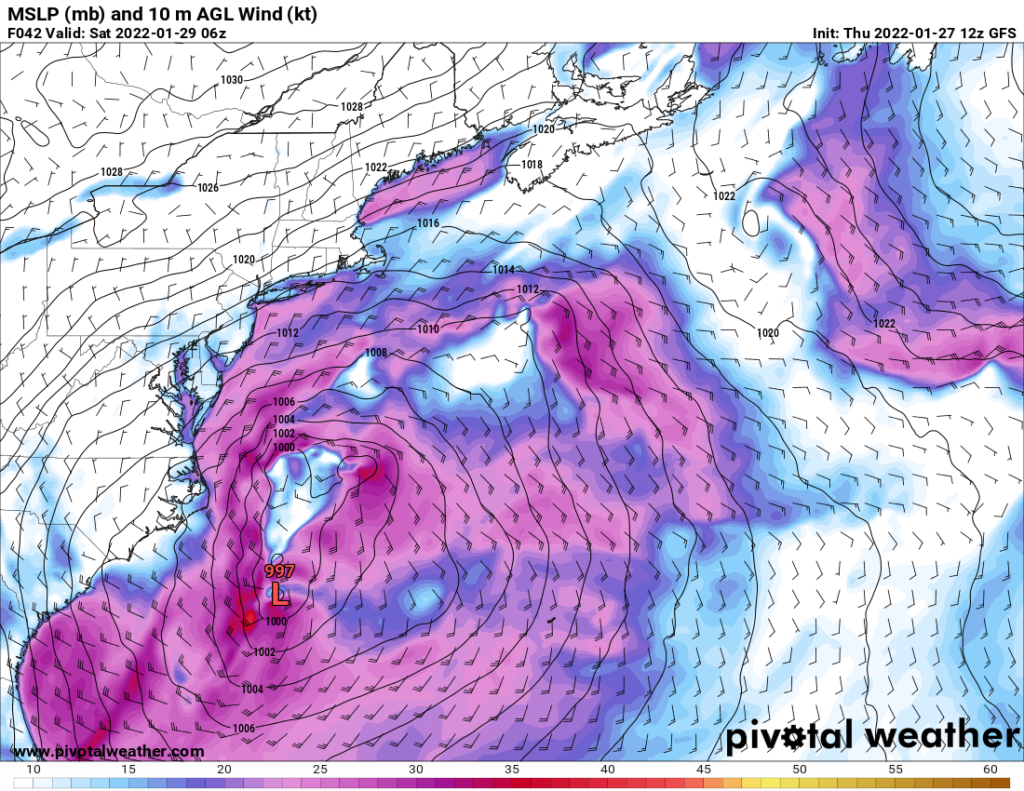
GFS: 997 mb Saturday at 1 AM EST 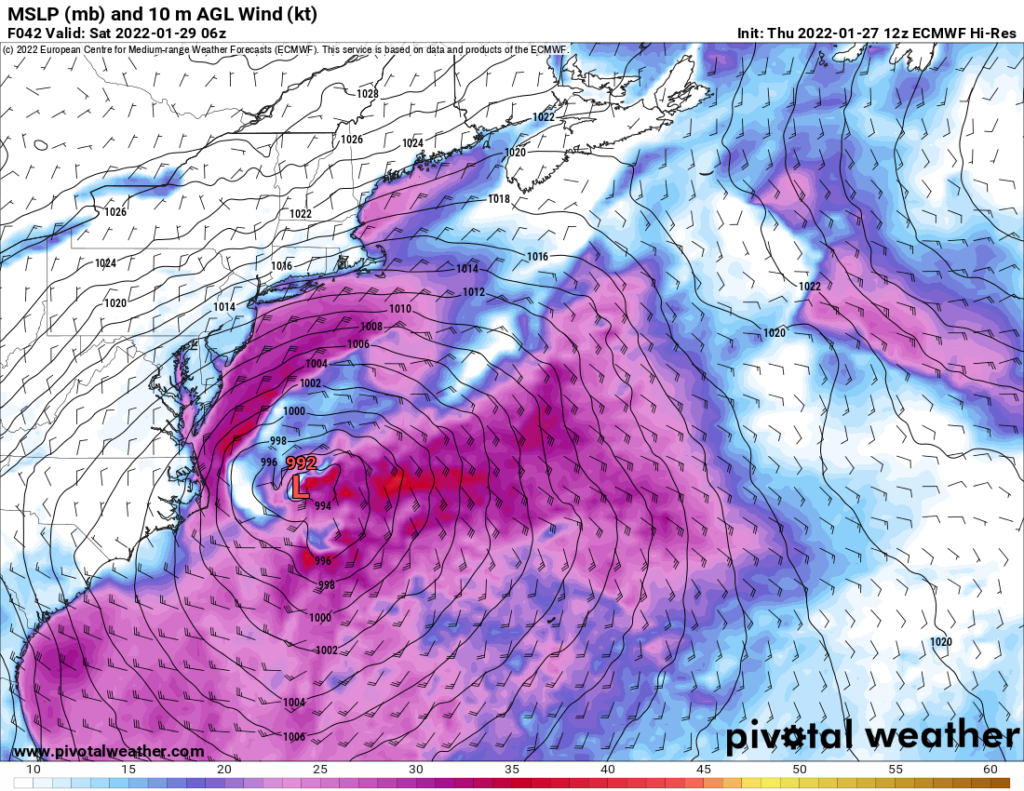
ECMWF: 992 mb Saturday at 1 AM EST 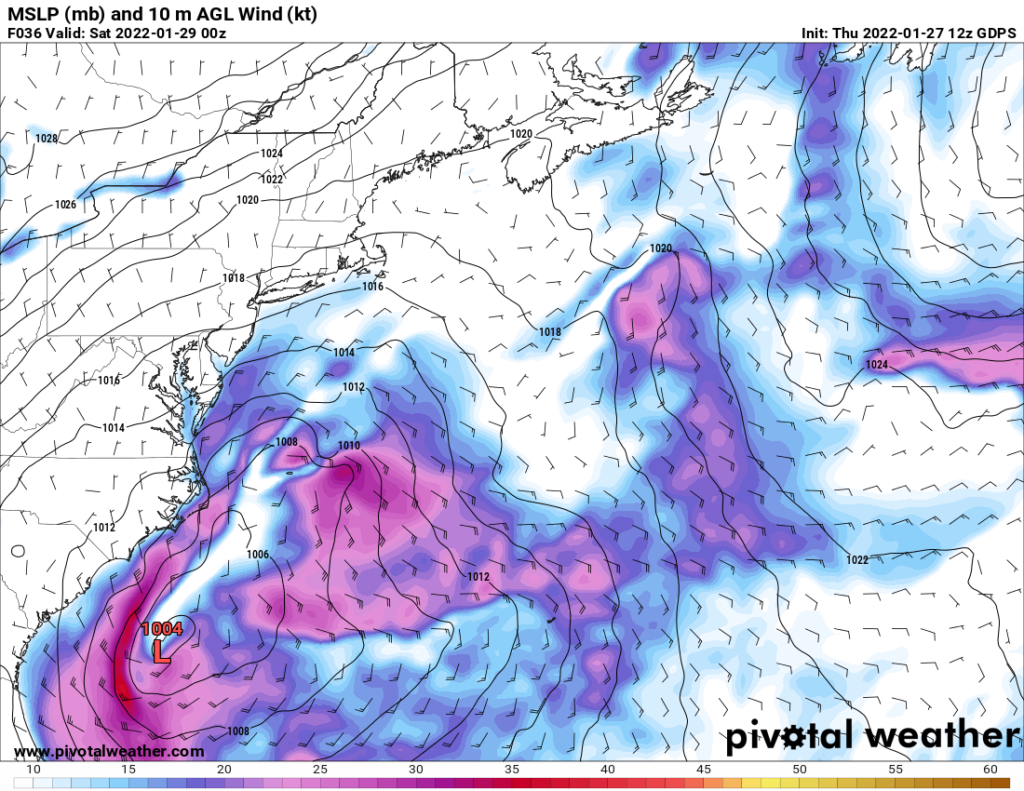
GDPS: 1004 mb Friday at 7 PM EST 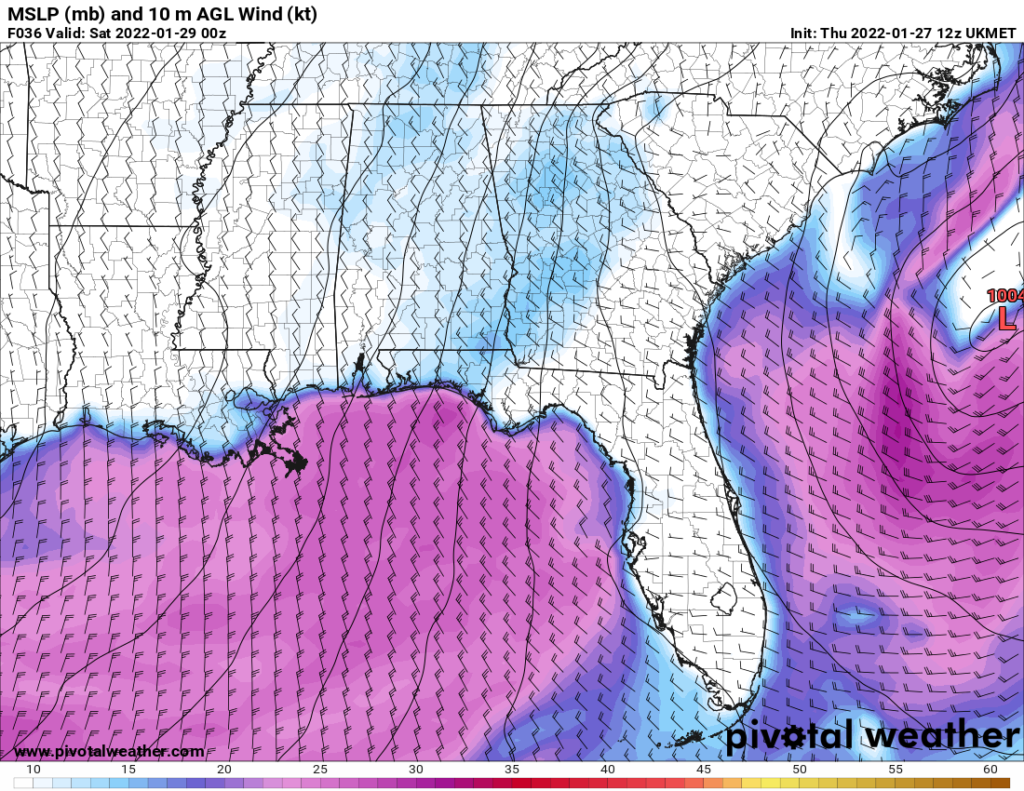
UKMET: 1004 mb Friday at 7 PM EST
So do the models expect the storm to bomb? Here are their official predictions.
| Model | Min Pressure | 24 Hrs Earlier | Pressure Drop | Bombs |
|---|---|---|---|---|
| GFS (American) | 967 mb | 997 mb | 30 mb | Yes |
| ECMWF (Euro) | 966 mb | 992 mb | 26 mb | Yes |
| GDPS (Canadian) | 967 mb | 1004 mb | 37 mb | Yes |
| UKMET (British) | 969 mb | 1004 mb | 35 mb | Yes |
Models are usually not this assertive, but that’s a pretty definitive yes. The storm will bomb. Cue Toots and the Maytals.
Wind Forecast
Whenever a nor’easter undergoes bombogenesis, one thing is assured: there will be wind. Lots of it. So just how much wind will there be? You probably remember the October bomb cyclone, which brought 100-plus mph (160 km/h) wind gusts to southeastern Massachusetts. Thankfully, I’ve got some good news for you: you won’t see winds like that with this storm.
Look North to Canada for the Best Indicators of Potential Wind Speeds
The fiercest nor’easters get their winds from the pressure gradient between the bombing low and a strong high pressure system over southern Québec. But have a look at this. The high over Québec is much further north and east than it traditionally is for the really bad storms. In fact, it’s not over Québec at all. It’s actually over Newfoundland and Labrador.

Because the high is further away, the pressure gradient won’t be as tight. As a result, wind speeds won’t be as high as they would have been had the high been closer. Don’t get me wrong, it’s still a tight pressure gradient, and you’ll still get plenty of wind. It just won’t be as bad as it could have been. Combined with the expectation that the center of the low will pass offshore instead of right over Cape Cod and the Islands, I expect winds to be less than the bomb cyclone that hit New England last October. Let’s look at the models.
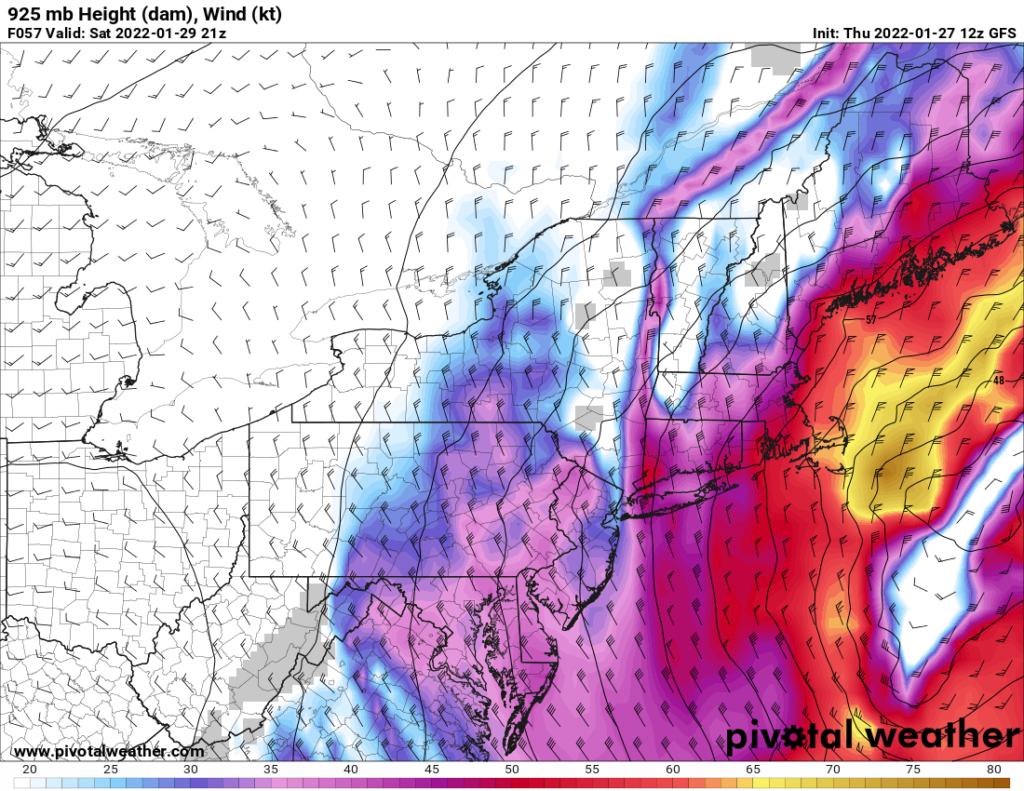
GFS (American) 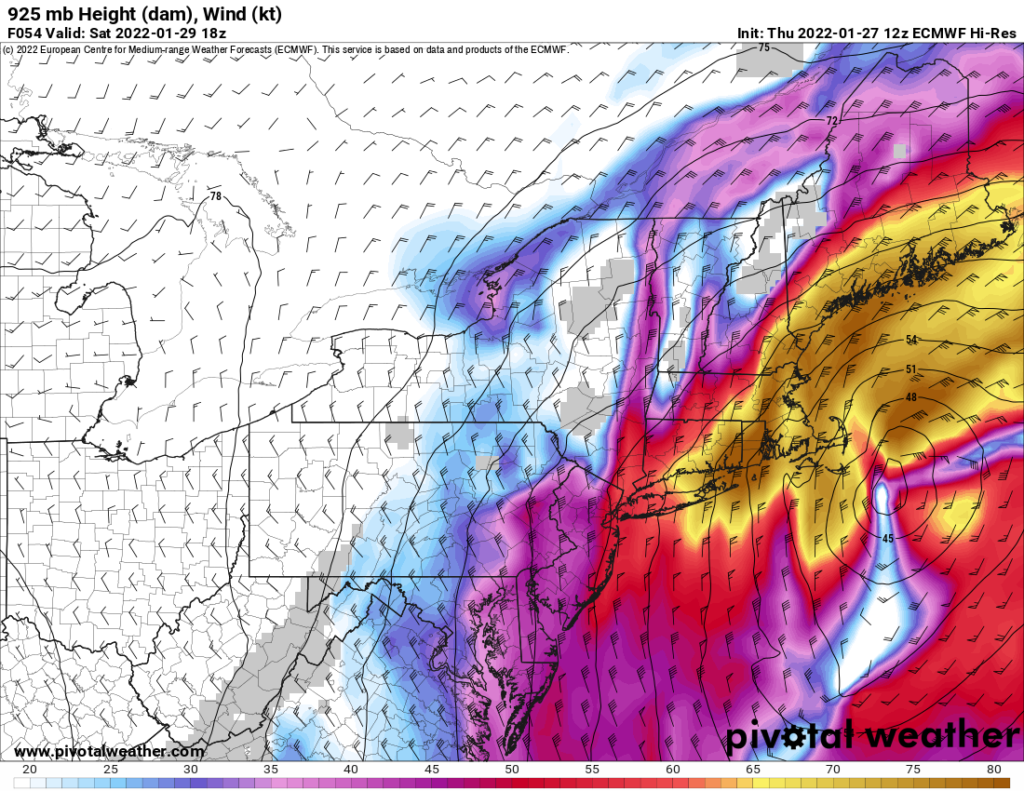
ECMWF (European) 
GDPS (Canadian) 
UKMET (British)


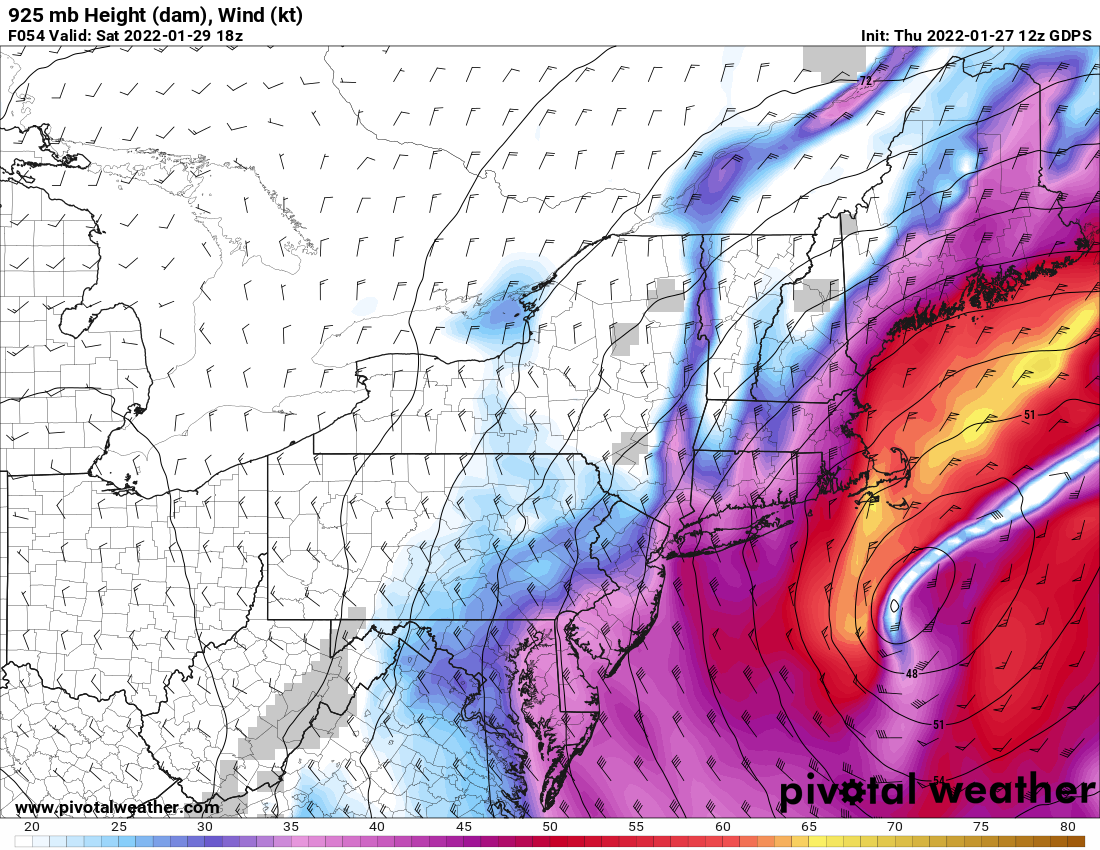
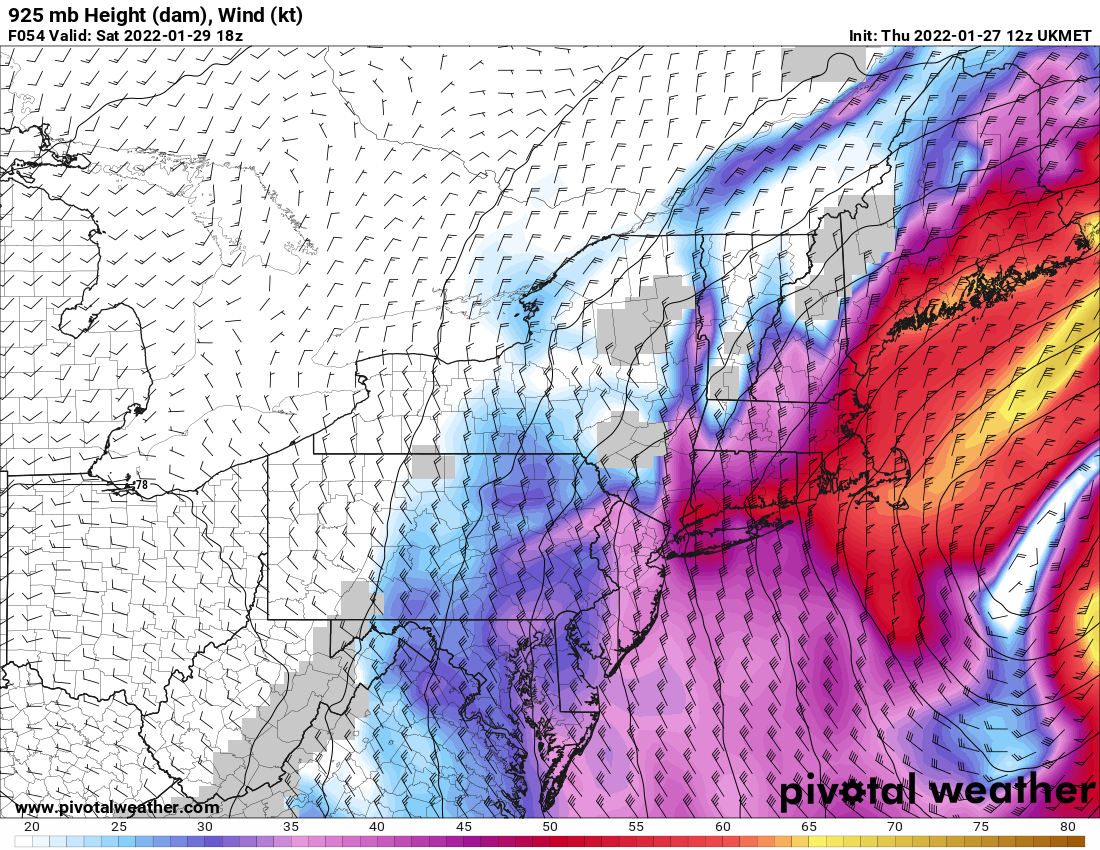
When I look at the models’ wind predictions, I prefer to look at the sustained winds about 400 to 500 meters above the ground, at 925 mb. In coastal areas, models can sometimes underestimate wind speeds when they try to calculate how friction and terrain impact the wind as it comes off the ocean. The 925 mb (400-500 meter) predictions remove those possible anomalies, and also give you the maximum potential wind speeds.
How Much Wind to Expect in New England
In the wind forecasts above, I don’t see any plausible scenario where the ECMWF (European) model forecast verifies. You just simply aren’t going to get winds that strong that far inland. Using the other three models, it’s clear that the strongest winds will be contained to the immediate coastal areas.
Areas that are exposed to the north along the South Shore and the Cape and Islands will see the greatest impacts from the wind. You’ll find the strongest winds on the Cape and Islands. Right now, my best guess is that sustained winds will peak in the 40-50 knot range in exposed areas across the Cape and Islands. Hurricane-force gusts are certainly possible, but I don’t expect anything close to the 100 mph gusts that ripped through during the October storm.
Temperature and Wind Chill: How Cold will the Bomb Cyclone Get?
Despite the availability of rich, tropical moisture, the bomb cyclone will have a very well-established cold core by the time it reaches New England. Furthermore, all of New England and the Canadian Maritimes will be on the cold side of the storm as it passes by. As a result, you should expect bitterly cold wind chills during the bomb cyclone. The models are all in agreement.
Expected Temperatures
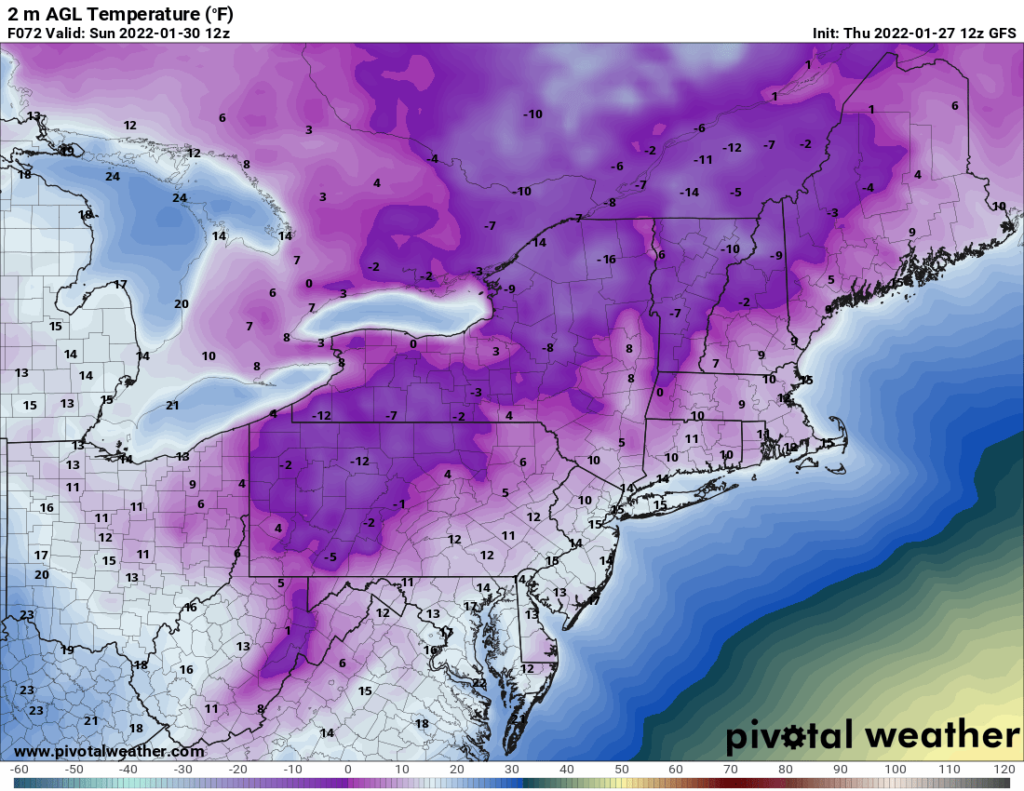
GFS (American) 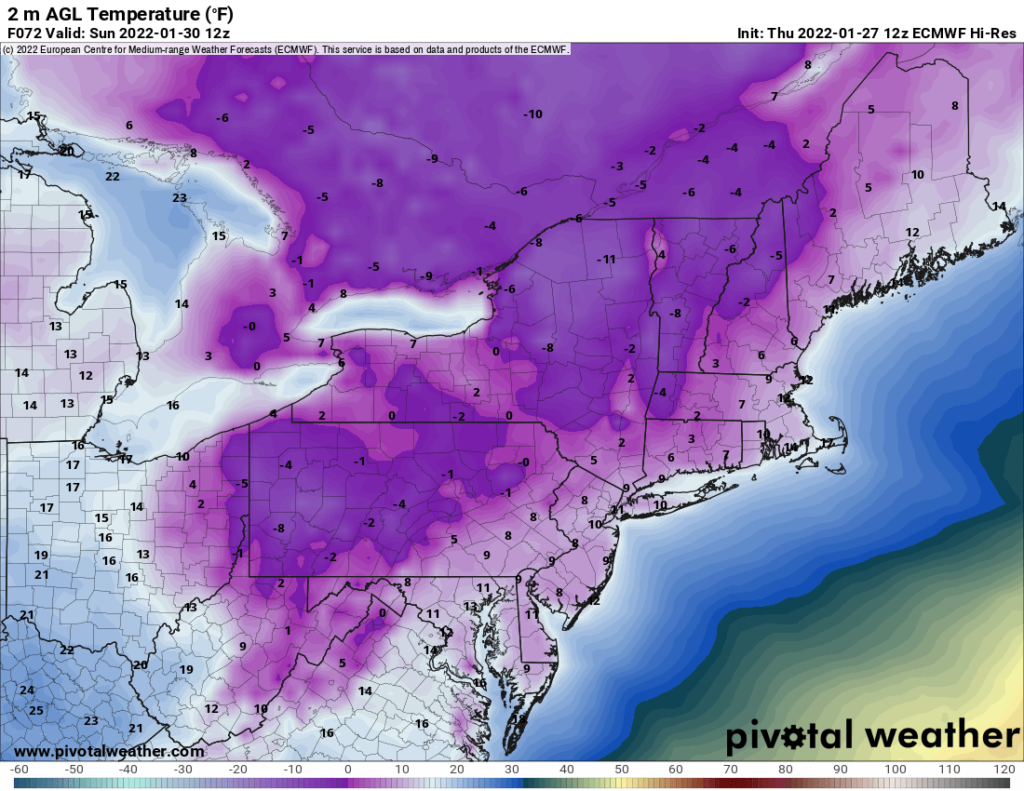
ECMWF (European) 
GDPS (Canadian) 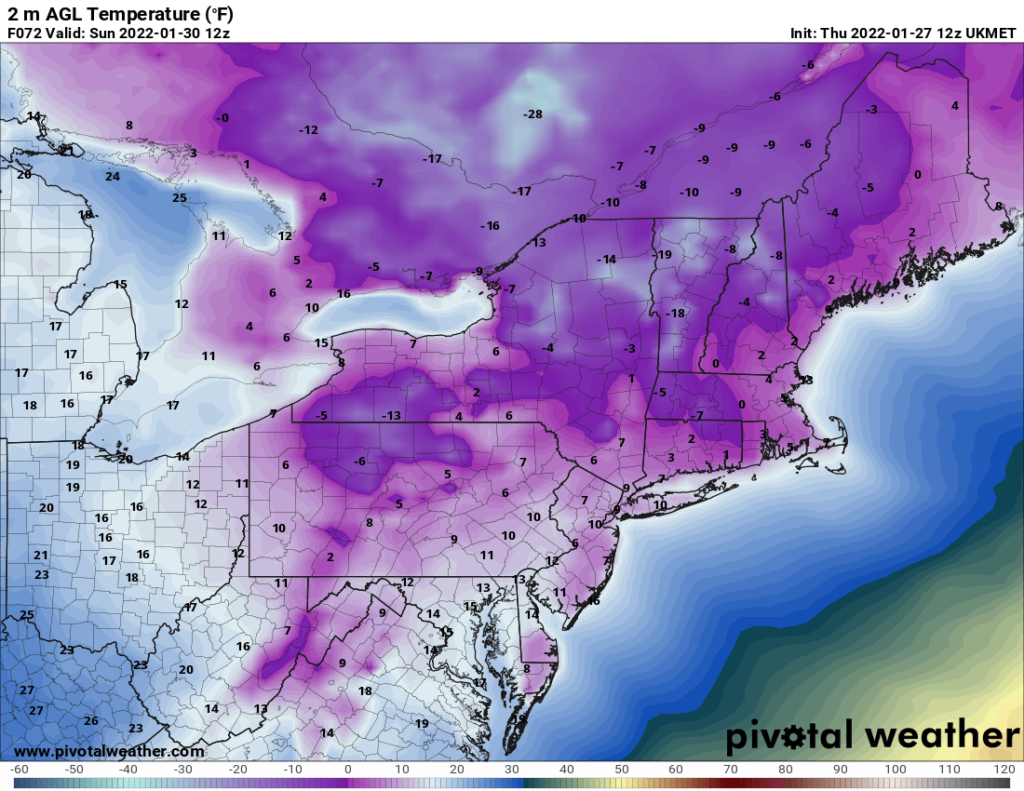
UKMET (British)


Expected Wind Chills

GFS (American) 
ECMWF (European) 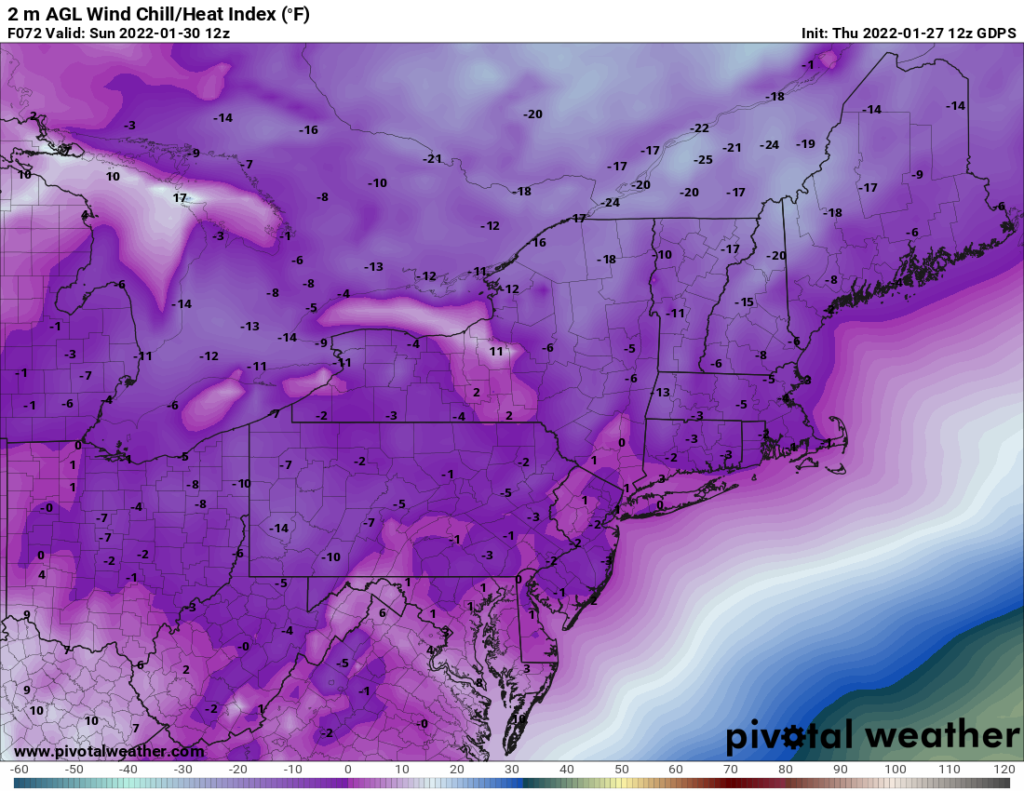
GDPS (Canadian) 
UKMET (British)
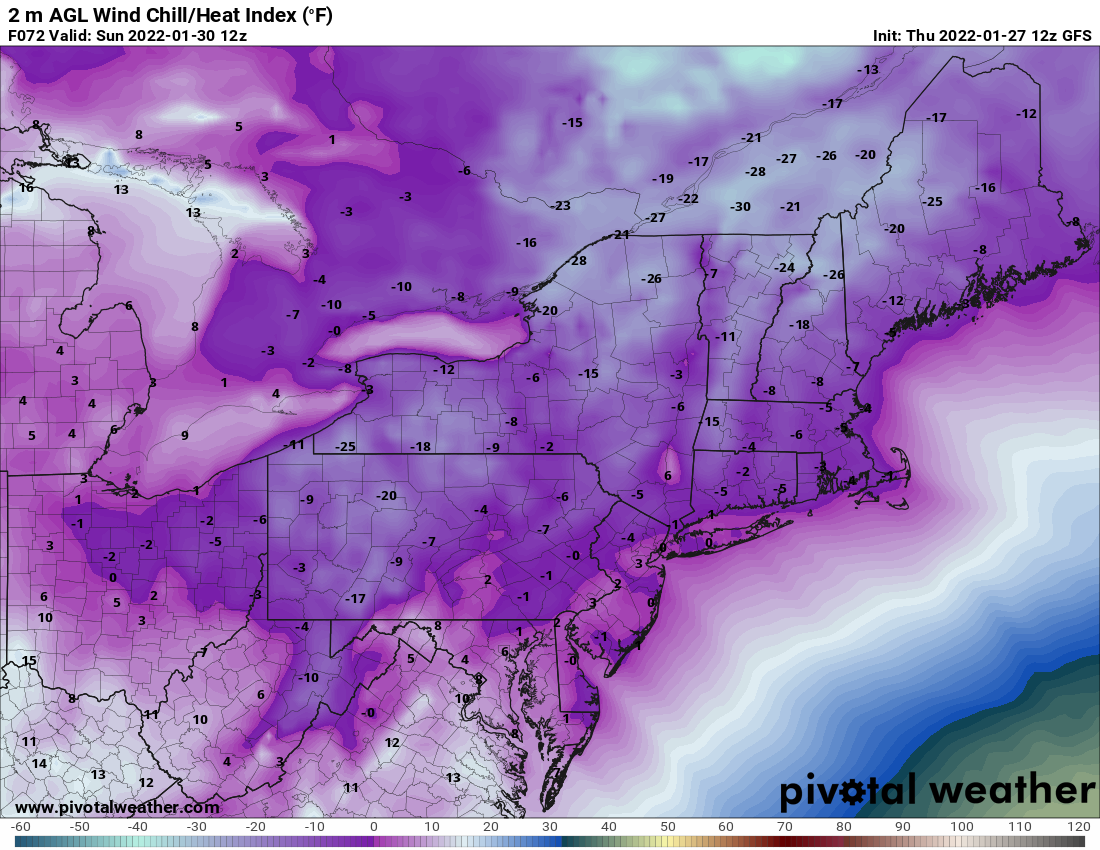


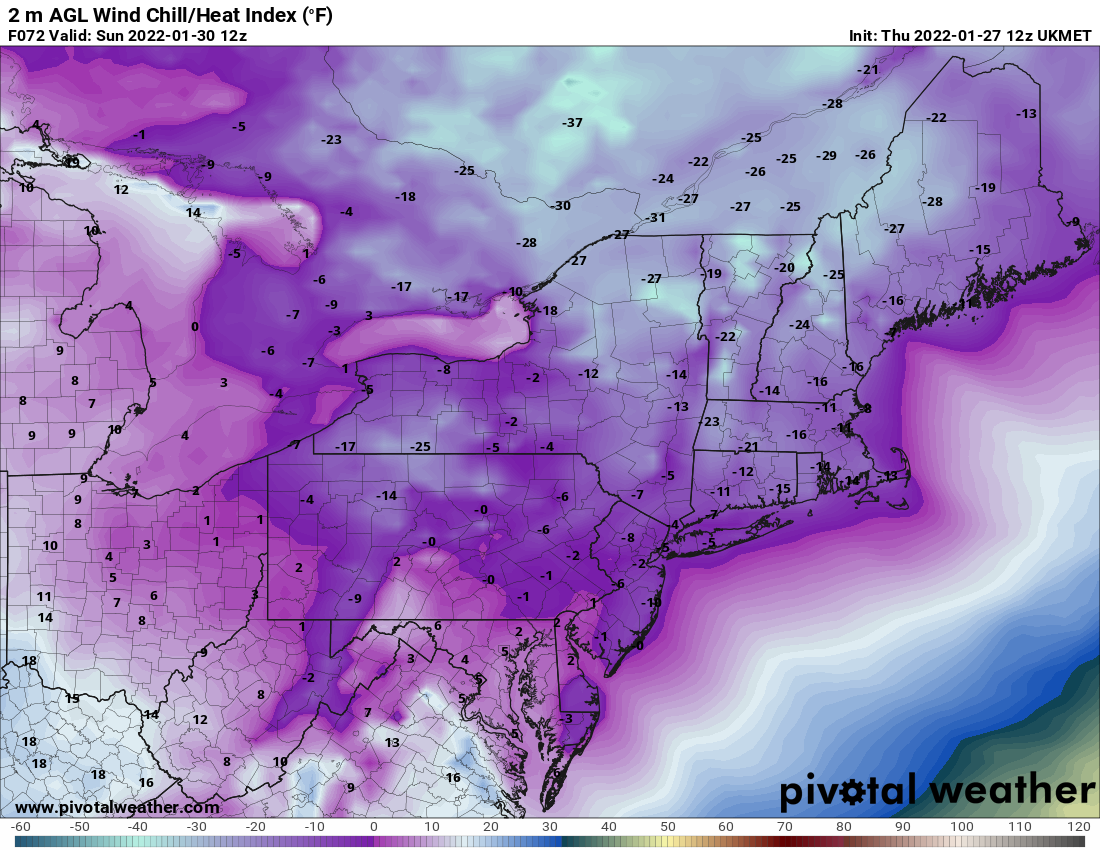
When looking at temperatures and wind chills, you really need to look at the coast vs inland. Even in extreme conditions, the ocean still helps regulate temperatures near the coast. That being said, with the exception of Martha’s Vineyard, Nantucket, and possibly parts of the outer Cape, wind chills will struggle to get out of the single digits. If you’re inland, you’ll see sub-zero wind chills for pretty much the duration of the event.
Precipitation Type
With strong northerly winds, sub-zero wind chills, and everywhere on the cold side of the system, it should not be a surprise that this will be a snow event. Parts of the outer Cape and the Islands may briefly see a little ice mix in during the warmest part of the storm early Saturday afternoon. Other than that, it will be all snow.
On the models, we’ll look at the maximum temperature in the vertical column of air during the warmest part of the storm. Blue and purple indicates that the entire column is below freezing. You will see snow in those areas. Areas in green may briefly see some ice or sleet mix in early Saturday afternoon before changing back to all snow. That’s a result of air on the warm side of the storm wrapping around the top of the low as it approaches.
The European and British models do not calculate the maximum vertical temperature, so we’ll only consider the American and Canadian models. As you can see, their two predictions are nearly identical.

GFS (American) 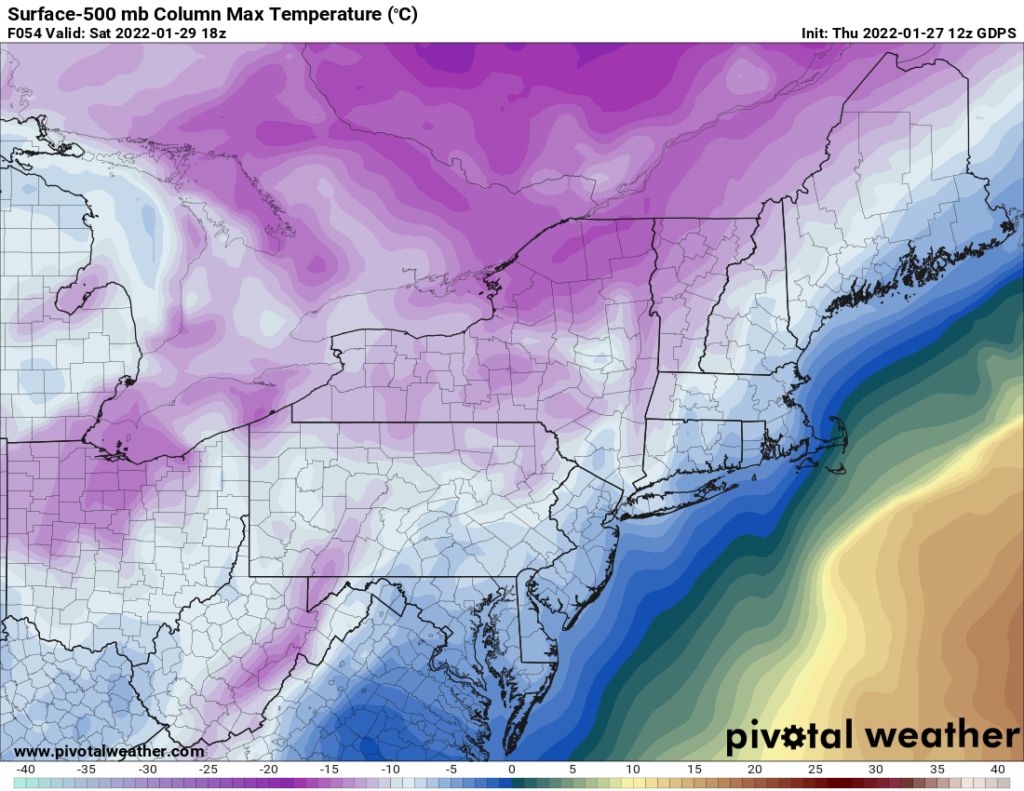
GDPS (Canadian)

Snowfall Totals Will Be Measured in Feet, Not Inches
Whenever you have a storm that has both bitterly cold temperatures and an ample fuel supply of rich, tropical moisture, you’re going to get massive snowfall totals. However, there is a bit of a silver lining. All four models are showing noticeably less snow totals than they were yesterday. Unfortunately, they are still showing around two to three feet maximum snowfall totals for this bomb cyclone.

GFS (American) 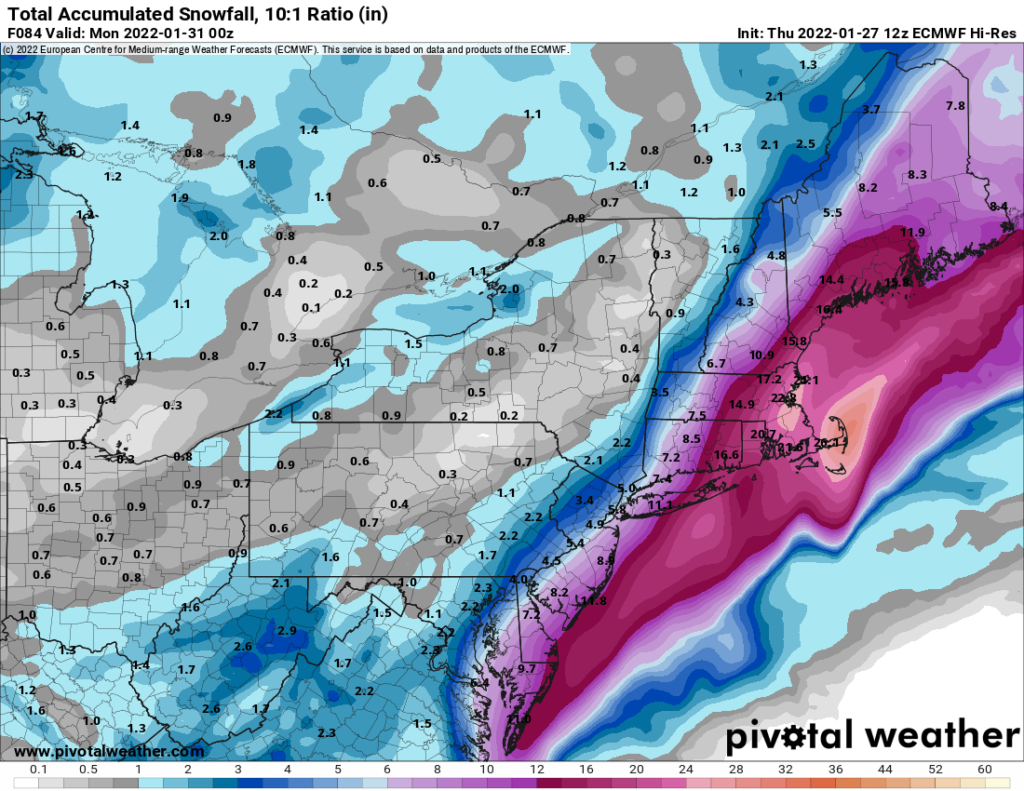
ECMWF (European) 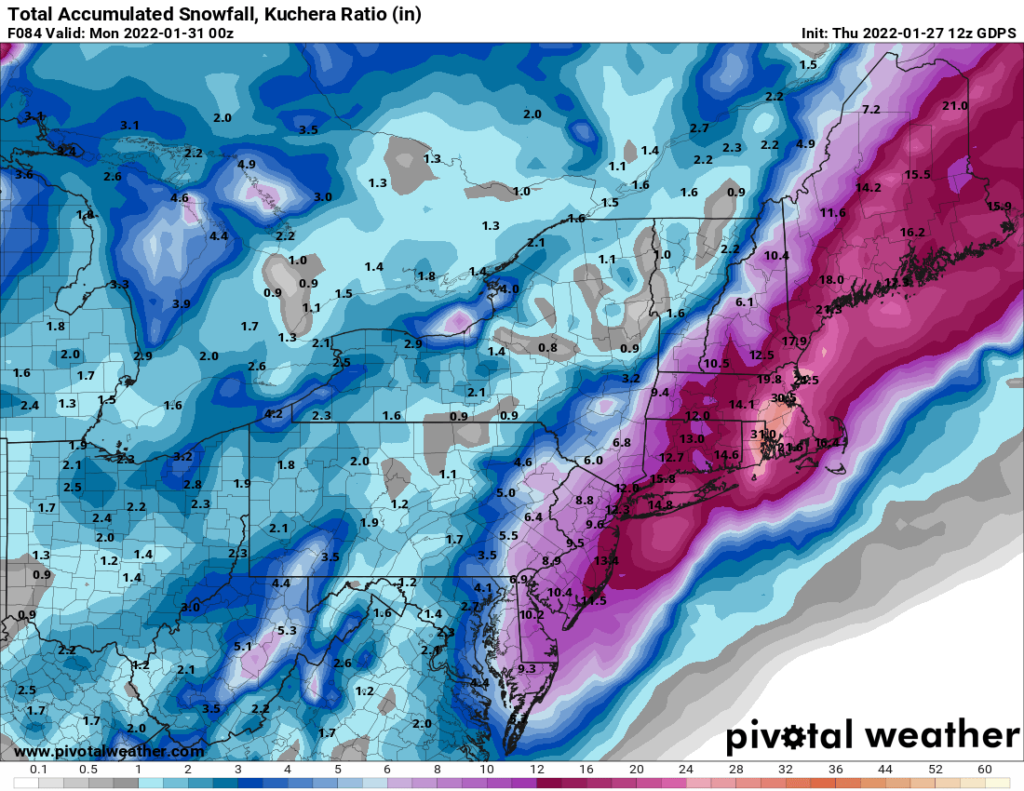
GDPS (Canadian) 
UKMET (British)
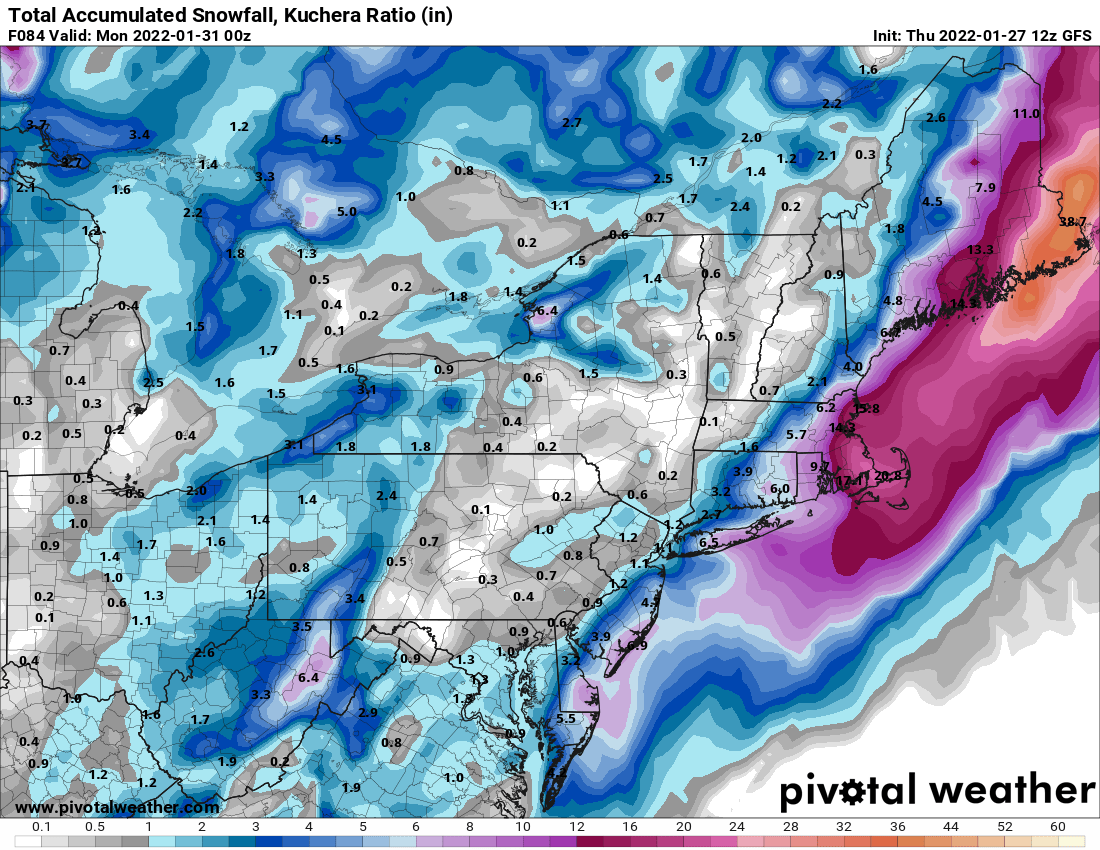


Because the GFS and GDPS models use the Kuchera Ratio, which is the most accurate, to predict snowfall, we’ll give the heaviest weight to those models. However, for a number of reasons, nailing down exact snowfall totals for a precise location is extremely difficult in this scenario.
- The low still hasn’t really formed yet, so we don’t have any actual data from it to feed into the models.
- The snowfall gradients are tight. A small wobble in the storm track can make a big difference in the snow totals. For example, take any of the above predictions and shift the snowfall totals 40-50 miles east or west.
- A westward shift in the storm’s track may mean some areas – particularly parts of the Cape and Islands – may see more ice, sleet, or mixed precipitation on Saturday afternoon, which would reduce snowfall totals. Again here, a small shift in the storm’s track can make a big difference. In this scenario, inland areas would also see greater snowfall totals.
- An eastern shift in the storm’s track would shift the precipitation shield east, meaning the heaviest snow could fall offshore.
How Much Snow Should You Expect?
We can give equal weight to all four models to determine where the heaviest snow will fall. Given my experience both with the models and with these types of bomb cyclones, I think the heaviest snow will set up in southeastern New England, along and east of the Interstate 95 corridor. Rhode Island will take a pretty good wallop, but will ultimately be spared the worst of the snowfall. Total accumulations will drop rapidly once you get west of I-95.
For the largest snow totals, I think 20 to 24 inches across Bristol and Plymouth Counties in Massachusetts is your safest bet at this point. That swath will likely spread across western Barnstable County (Cape Cod) and up into the far southern suburbs of Boston as well. 28 to 32 inches in a few isolated spots is certainly not out of the question, either, but I am not expecting widespread totals above 2 feet.
Summary
I know there’s a lot of information in this post, so let’s put it into a nice, clean table to summarize everything.
| Parameter | GFS (American) | ECMWF (European) | GDPS (Canadian) | UKMET (British) | My Forecast |
|---|---|---|---|---|---|
| Track | Just offshore Cape and Islands | Just offshore Cape and Islands | Just offshore Cape and Islands | Far offshore, into Nova Scotia | Just offshore Cape and Islands |
| Closest Pass | Sat, 29 Jan 10 PM EST | Sat, 29 Jan 7 PM EST | Sat, 29 Jan 7 PM EST | Sat, 29 Jan 1 PM EST | Sat, 29 Jan 7 PM EST |
| Min. Pressure | 967 mb | 966 mb | 967 mb | 969 mb | 967 mb |
| Bombs | Yes | Yes | Yes | Yes | Yes |
| Max. Coastal Winds | 50 to 70 kt | 70 to 90 kt | 40 to 60 kt | 50 to 60 kt | 40 to 50 kt |
| Onshore Wind Direction | North | North | North | North | North |
| Coldest Coastal Temps | 5 to 15°F | 8 to 15°F | 7 to 15 °F | 0 to 10°F | 5 to 15°F |
| Coldest Coastal Wind Chills | -15 to 5°F | -10 to 5°F | -10 to 0°F | -20 to -10°F | -15 to 0°F |
| Max Snowfall | 22 to 26 in | 28 to 32 in | 28 to 32 in | 20 to 24 in | 20 to 24 in |
| Max Snowfall Location | Plymouth and Barnstable Counties, MA | Cape Cod and Boston | I-95 Corridor Boston to Providence | Cape Cod and Islands | Bristol and Plymouth Counties, MA |
Conclusion
Like many other bomb cyclones, this is certainly a storm that you’re certainly going to want to take seriously. However, New England has certainly gone through far worse in the past. Make sure you stock up on what you’ll need for a few days, and then hunker down at home and enjoy it. The storm is fast moving, so it’ll be in and out in only about 24 hours. Then it’s just a matter of digging out, cleaning up, and getting back to your normal routine.
If you have any questions about anything related to this storm, please let me know in the comments below or reach out to me directly.
Hello Matt. Thank you so much for this very thorough analysis of what’s coming to us tomorrow. It is very frightening but we’re hardy New Englanders and we will survive (albeit a bit shaken and exhausted from shoveling!)! Thank you again; wish us all good luck.! Betty
Thanks, Betty! Hope you all made it through okay.
Thanks, Matt. Interesting and informative and, as before, good advice in the Conclusion.
Thanks, Betsy!